Average vs median days · Lévis · 2026
Which houses linger before selling in Lévis, bracket by bracket: average against median days on market over the past twelve months, the ratio between the two, the bracket where listings drag on and the one where the market decides fast. Centris sales, nothing estimated.
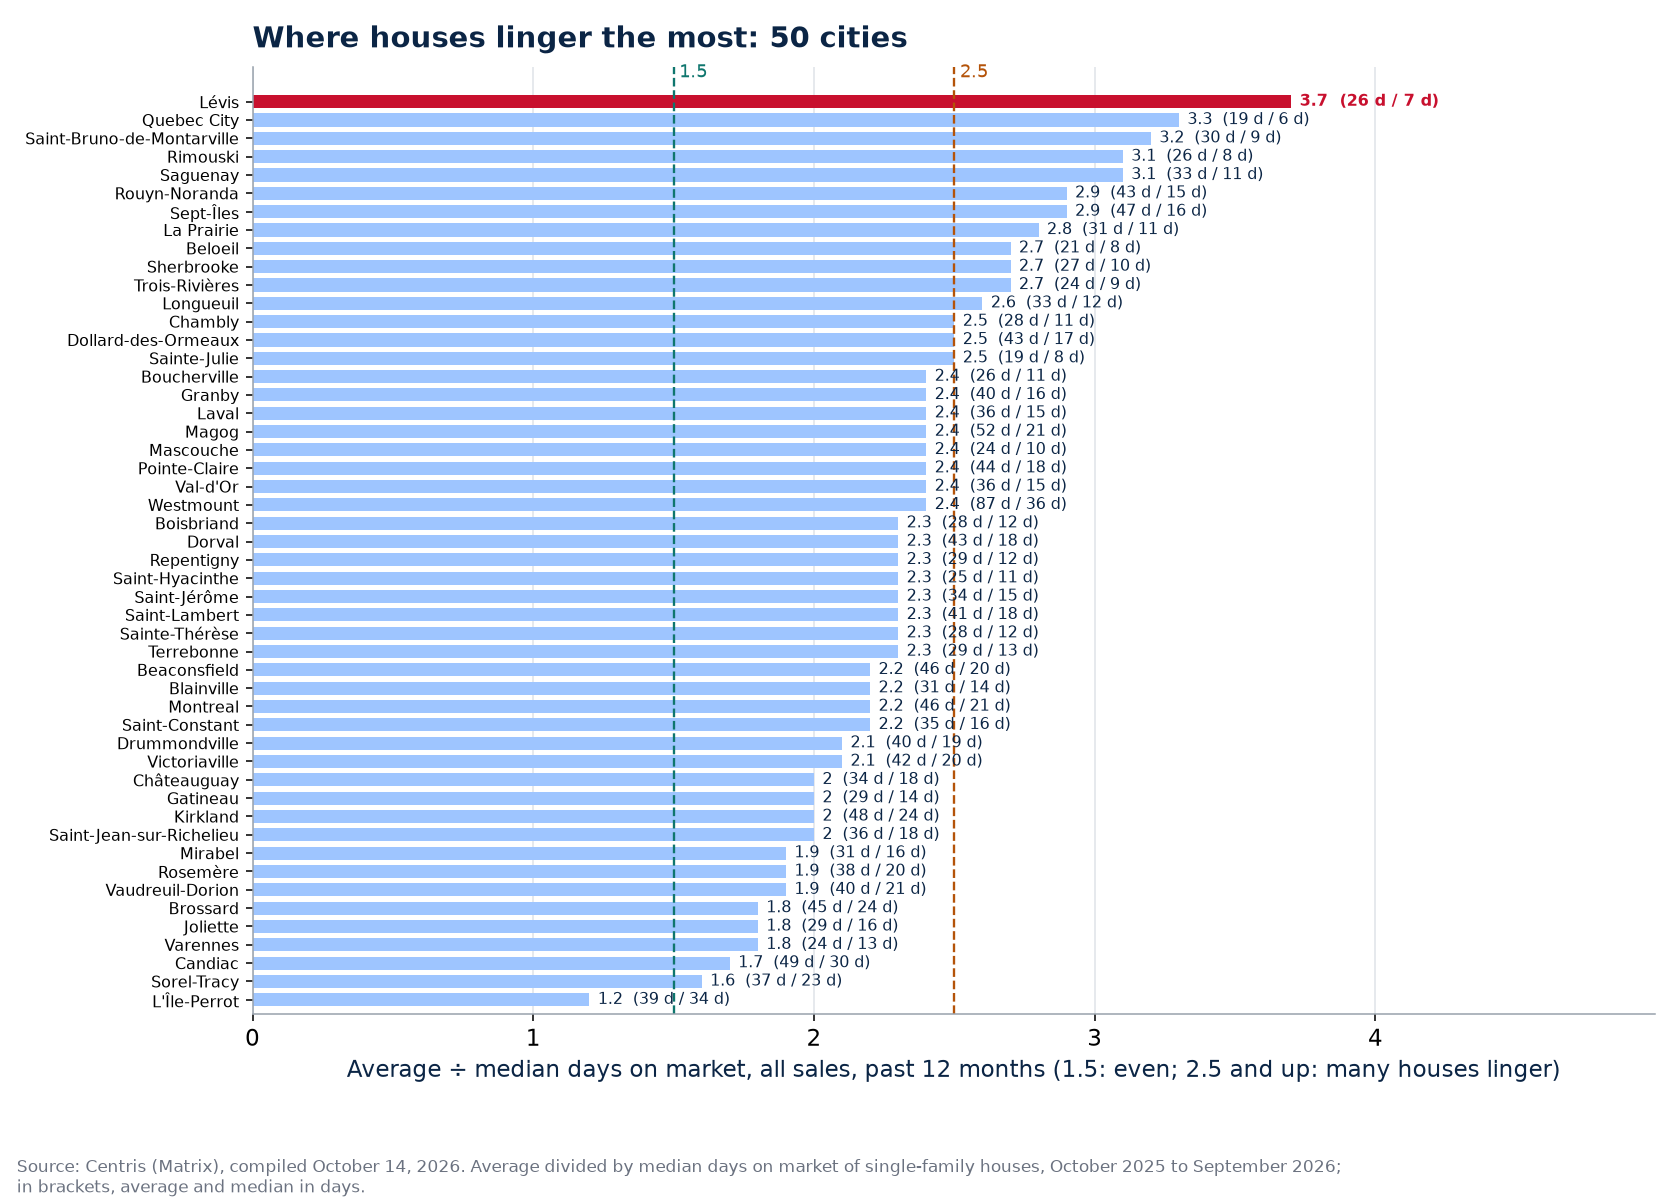
In Lévis, over the past 12 months (October 2025 to September 2026), the typical house sold in 7 days (median), but the average sale took 26 days: a ratio of 3.7 times, many houses linger. By bracket: under $300,000, 14 days in median, 25 on average (ratio 1.8); $300,000 to $500,000, 5 days in median, 20 on average (ratio 3.9); $500,000 to $800,000, 8 days in median, 30 on average (ratio 3.9); $800,000 to $1M, 7 days in median, 54 on average (ratio 8.2); $1M and up, 20 days in median, 78 on average (ratio 3.9). The stickiest bracket is $800,000 to $1M (8.2 times), the most even under $300,000 (1.8 times). It is one of the cities where lingering houses weigh the most on the average among the 50 tracked (median ratio 2.3). Source: Centris (Matrix), compiled October 14, 2026.
The short answer
In Lévis, over the past 12 months (October 2025 to September 2026), the typical house sold in 7 days (median), but the average sale took 26 days: a ratio of 3.7 times, many houses linger. By bracket: under $300,000, 14 days in median, 25 on average (ratio 1.8); $300,000 to $500,000, 5 days in median, 20 on average (ratio 3.9); $500,000 to $800,000, 8 days in median, 30 on average (ratio 3.9); $800,000 to $1M, 7 days in median, 54 on average (ratio 8.2); $1M and up, 20 days in median, 78 on average (ratio 3.9). The stickiest bracket is $800,000 to $1M (8.2 times), the most even under $300,000 (1.8 times). It is one of the cities where lingering houses weigh the most on the average among the 50 tracked (median ratio 2.3).
Average and median days on market by price bracket

| Price bracket | Sales | Median days | Average days | Average ÷ median | Reading |
|---|---|---|---|---|---|
| under $300,000 | 100 | 14 days | 25 days | 1.8 | a few houses linger |
| $300,000 to $500,000 | 728 | 5 days | 20 days | 3.9 | many houses linger |
| $500,000 to $800,000 | 334 | 8 days | 30 days | 3.9 | many houses linger |
| $800,000 to $1M | 45 | 7 days | 54 days | 8.2 | many houses linger |
| $1M and up | 35 | 20 days | 78 days | 3.9 | many houses linger |
| All sales | 1,242 | 7 days | 26 days | 3.7 | many houses linger |
Average days on market and median days on market by bracket, weighted by the sales of ranges with at least 5 sales, Single-family category, past 12 months (October 2025 to September 2026), Centris (Matrix), October 13-14, 2026 harvest. Reading grid, the same on all our pages: a ratio under 1.5 = even timing (the average sticks to the median); 1.5 to 2.5 = a few houses linger; 2.5 and up = many houses linger a long time before selling.
The fine ranges
| Centris range | Sales | Median | Average | Ratio |
|---|---|---|---|---|
| $0 to $100,000 | 1 | n/a | n/a | n/a |
| $100,000 to $150,000 | 6 | 6 days | 29 days | 4.8 |
| $150,000 to $200,000 | 21 | 28 days | 31 days | 1.1 |
| $200,000 to $250,000 | 31 | 11 days | 28 days | 2.5 |
| $250,000 to $300,000 | 41 | 10 days | 20 days | 2 |
| $300,000 to $350,000 | 107 | 5 days | 20 days | 4 |
| $350,000 to $400,000 | 191 | 5 days | 20 days | 4 |
| $400,000 to $450,000 | 252 | 5 days | 22 days | 4.4 |
| $450,000 to $500,000 | 178 | 5 days | 16 days | 3.2 |
| $500,000 to $600,000 | 182 | 6 days | 24 days | 4 |
| $600,000 to $700,000 | 107 | 11 days | 41 days | 3.7 |
| $700,000 to $800,000 | 45 | 7 days | 30 days | 4.3 |
| $800,000 to $900,000 | 33 | 5 days | 42 days | 8.4 |
| $900,000 to $1,000,000 | 12 | 11 days | 88 days | 8 |
| $1M and up | 35 | 20 days | 78 days | 3.9 |
What the gap says in Lévis
- The stickiest bracket: $800,000 to $1M, 7 days in median but 54 days on average, 8.2 times. Half the houses go fast there; the other half includes listings that wait for months, enough to pull the average 47 days above the median.
- The most even bracket: under $300,000, 1.8 times (14 days in median, 25 days on average). Few houses are left behind there: the market decides fast either way.
- Brackets where many houses linger (ratio of 2.5 and up): $300,000 to $500,000, $500,000 to $800,000, $800,000 to $1M, $1M and up. That is where a poorly prepared or overpriced listing sits for months without an offer while the others go in two weeks.
- Bottom versus top of the market: ratio of 3.4 under $500,000 and 5.2 at $800,000 and up: the top of the market has more houses that linger. It is the case in 12 cities out of 35.
- Across the 50 cities tracked, the typical house sells in 15 days in median of cities, the average sale takes 34 days: ratio 2.3; by bracket, under $300,000 1.9; $300,000 to $500,000 2.4; $500,000 to $800,000 2.4; $800,000 to $1M 1.9; $1M and up 2.3. The stickiest bracket is most often $300,000 to $500,000 (17 cities), the most even $800,000 to $1M (16 cities); 15 cities have a ratio of 2.5 and up all sales, 1 a ratio under 1.5.
And over the year: the annual series
Over the year 2026 (January to September), our annual series gives 25 days of average days and 6 days of median days all ranges in Lévis, a ratio of 4.2; the twelve months on this page (October 2025 to September 2026) give 3.7. The two windows only partly overlap; what this page adds is the bracket: the ratio is not the same at every price.
What it changes for selling or buying in Lévis
In Lévis, two markets live in the same city: the well-listed house goes in 7 days, and a minority of listings stay long enough to carry the average to 26 days. For a seller, the danger is to believe one is in the average: the median is the true timing of a house at market price; the average is the timing of those that missed their entry (price too high, weak photos, off-season launch) and that end up selling after one or two cuts, when they sell. In $800,000 to $1M, it is the bracket not to miss on day one. For a buyer, lingering houses are where an offer below asking has the best odds: they show by their days on market, well beyond the bracket's median. Median days by bracket, alone, are in days on market by price in Lévis; average and median year by year, with expired listings, in houses that do not sell in Lévis; days on market over ten years, in days on market in Lévis.
How to read these figures
Two timings per bracket. The median splits sales in two: half the houses found a taker in under 7 days in Lévis, the other half in more. The average adds up every day on market and divides by sales: a single house sold after 200 days weighs as much as ten houses sold in 20 days. The average-to-median ratio therefore measures the tail: the higher it is, the more listings lingered a long time before selling. Reading grid, the same on all our pages: a ratio under 1.5 = even timing (the average sticks to the median); 1.5 to 2.5 = a few houses linger; 2.5 and up = many houses linger a long time before selling. Brackets with fewer than 5 sales are not published.
Frequently asked questions
How long to sell in Lévis: the average or the median?
Both are true in Lévis: 7 days in median, 26 days on average, over the past 12 months (October 2025 to September 2026). The median is the timing of the typical house; the average is pulled up by the houses that linger. The ratio of 3.7 (many houses linger) says by how much.
In which price bracket do houses linger the most in Lévis?
$800,000 to $1M: 7 days in median, 54 days on average, a ratio of 8.2. Across the 50 cities tracked, the stickiest bracket is most often $300,000 to $500,000 (17 cities).
Why do some houses linger in Lévis?
Three causes come back: a starting price above the bracket's comparable sales, a weak launch (photos, description, availability for showings) and an off-season entry. The market does not punish at once: it ignores, then the house cuts its price and sells after months, which inflates the average. In Lévis, the $800,000 to $1M bracket is where it happens the most. The share of listings that never close at all is in houses that do not sell in Lévis.
Are these figures Centris counts or estimates?
Yes: average days on market and median days on market by range come from Centris (Matrix), on the sales of the past twelve months. The ratio between the two is a simple quotient; the reading grid (1.5 and 2.5) is ours, the same on every page. Brackets group the ranges by weighting with the sales of the same period, which is an average of averages: a faithful order of magnitude, not a sale-by-sale recalculation.
Sources: Centris (Matrix), Statistics module, October 13 and 14, 2026 query for the municipality of Lévis, Single-family category, past-12-months period, grouping by sale price, average days on market and median days on market by range; sales by range from the October 9 and 10, 2026 query (same period); compiled by the Loaa & Manseur team, aggregates only. The houses that linger by price range in 50 cities hub compares the 50 cities.
Our proof, not our promises
The Loaa & Manseur team, led by Lotfi Manseur and Loaa Al Daow, is the number 1 team at RE/MAX Platine in 2024 and 2025, 6th RE/MAX team in Quebec, 15th in Canada and in the global top 50 of large residential teams according to the official RE/MAX ranking, computed on actual transactions. Its Google profile counts more than 220 reviews with a 4.9 rating. Its offices are at 55 avenue de l'Équinoxe in Brossard, one bridge from the island, and every broker's licence can be checked in the OACIQ public register. Three things to verify yourself before calling us, and to demand of any other broker.
Also available in French: version française de ce guide.
Published September 7, 2026 by the Loaa & Manseur team, the number 1 team at RE/MAX Platine in 2024 and 2025, 6th RE/MAX team in Quebec, 15th in Canada and in the global top 50 according to the official RE/MAX ranking. Tell us about your project.