2016-2026 rankings · Biggest gains
The biggest price gains 2016-2026: the table of the 50 cities ranked on Centris sales from January to September 2026, how to read the ranking and what it changes for buying or selling. Nothing estimated, ranks computed.
The city where a house gained the most value in ten years is Trois-Rivières: $148,000 in 2016, $410,000 in 2026, +177% ($262,000, 10.7% a year), ahead of Magog (+175%) and Saint-Jérôme (+158%). The median of the 50 cities is +124%, and 42 cities doubled. The smallest gain, Sept-Îles, is +58%. Source: Centris (Matrix), compiled October 13, 2026.
The short answer
The city where a house gained the most value in ten years is Trois-Rivières: $148,000 in 2016, $410,000 in 2026, +177% ($262,000, 10.7% a year), ahead of Magog (+175%) and Saint-Jérôme (+158%). The median of the 50 cities is +124%, and 42 cities doubled. The smallest gain, Sept-Îles, is +58%.
The ranking of the 50 cities
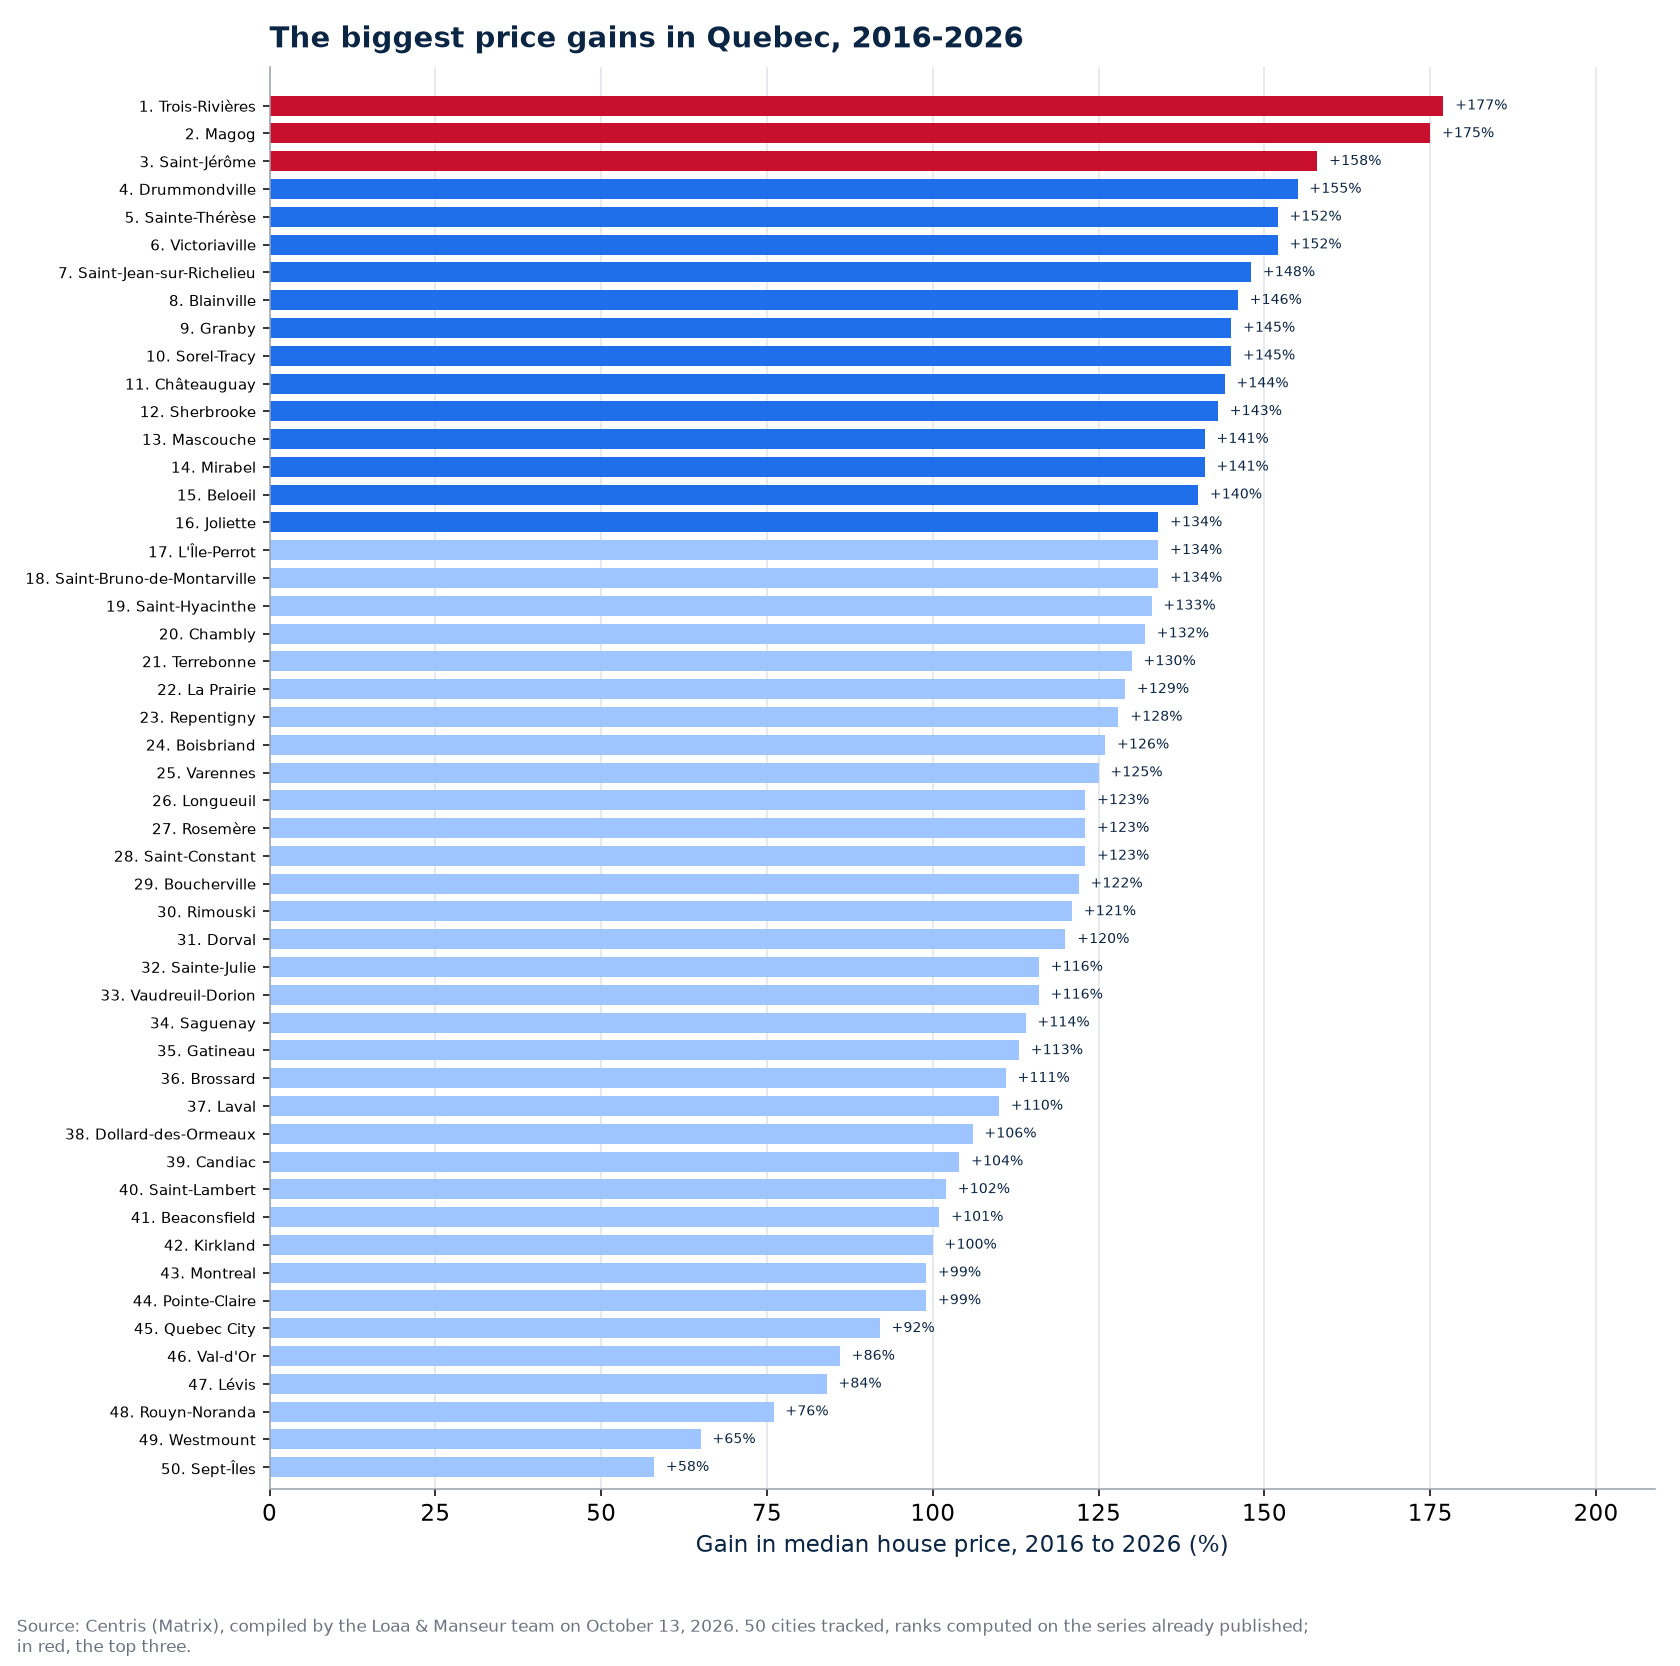
| Rank | City | Gain 2016-2026 | House 2016 | House 2026 | Gain in $ | Per year |
|---|---|---|---|---|---|---|
| 1 | Trois-Rivières | 177% | $148,000 | $410,000 | $262,000 | 10.7% |
| 2 | Magog | 175% | $218,492 | $600,000 | $381,508 | 10.6% |
| 3 | Saint-Jérôme | 158% | $212,338 | $547,500 | $335,162 | 9.9% |
| 4 | Drummondville | 155% | $168,500 | $429,900 | $261,400 | 9.8% |
| 5 | Sainte-Thérèse | 152% | $258,125 | $650,000 | $391,875 | 9.7% |
| 6 | Victoriaville | 152% | $145,000 | $366,000 | $221,000 | 9.7% |
| 7 | Saint-Jean-sur-Richelieu | 148% | $233,000 | $577,000 | $344,000 | 9.5% |
| 8 | Blainville | 146% | $308,950 | $760,000 | $451,050 | 9.4% |
| 9 | Granby | 145% | $189,000 | $462,543 | $273,543 | 9.4% |
| 10 | Sorel-Tracy | 145% | $160,000 | $391,750 | $231,750 | 9.4% |
| 11 | Châteauguay | 144% | $213,000 | $520,000 | $307,000 | 9.3% |
| 12 | Sherbrooke | 143% | $188,500 | $458,500 | $270,000 | 9.3% |
| 13 | Mascouche | 141% | $255,000 | $615,000 | $360,000 | 9.2% |
| 14 | Mirabel | 141% | $270,000 | $650,000 | $380,000 | 9.2% |
| 15 | Beloeil | 140% | $262,000 | $630,000 | $368,000 | 9.2% |
| 16 | Joliette | 134% | $197,000 | $460,000 | $263,000 | 8.9% |
| 17 | L'Île-Perrot | 134% | $239,950 | $561,500 | $321,550 | 8.9% |
| 18 | Saint-Bruno-de-Montarville | 134% | $350,000 | $819,500 | $469,500 | 8.9% |
| 19 | Saint-Hyacinthe | 133% | $218,000 | $507,500 | $289,500 | 8.8% |
| 20 | Chambly | 132% | $297,400 | $689,000 | $391,600 | 8.8% |
| 21 | Terrebonne | 130% | $260,000 | $599,000 | $339,000 | 8.7% |
| 22 | La Prairie | 129% | $323,800 | $740,000 | $416,200 | 8.6% |
| 23 | Repentigny | 128% | $258,400 | $588,000 | $329,600 | 8.6% |
| 24 | Boisbriand | 126% | $278,250 | $630,000 | $351,750 | 8.5% |
| 25 | Varennes | 125% | $281,000 | $631,000 | $350,000 | 8.4% |
| 26 | Longueuil | 123% | $269,750 | $602,000 | $332,250 | 8.4% |
| 27 | Rosemère | 123% | $379,450 | $845,000 | $465,550 | 8.3% |
| 28 | Saint-Constant | 123% | $277,750 | $620,000 | $342,250 | 8.4% |
| 29 | Boucherville | 122% | $364,450 | $810,000 | $445,550 | 8.3% |
| 30 | Rimouski | 121% | $179,000 | $395,000 | $216,000 | 8.2% |
| 31 | Dorval | 120% | $324,000 | $712,500 | $388,500 | 8.2% |
| 32 | Sainte-Julie | 116% | $309,500 | $667,400 | $357,900 | 8.0% |
| 33 | Vaudreuil-Dorion | 116% | $280,000 | $605,000 | $325,000 | 8.0% |
| 34 | Saguenay | 114% | $170,750 | $366,000 | $195,250 | 7.9% |
| 35 | Gatineau | 113% | $230,000 | $490,000 | $260,000 | 7.9% |
| 36 | Brossard | 111% | $348,000 | $734,200 | $386,200 | 7.8% |
| 37 | Laval | 110% | $300,000 | $630,000 | $330,000 | 7.7% |
| 38 | Dollard-des-Ormeaux | 106% | $385,000 | $792,500 | $407,500 | 7.5% |
| 39 | Candiac | 104% | $425,000 | $866,000 | $441,000 | 7.4% |
| 40 | Saint-Lambert | 102% | $554,000 | $1,120,000 | $566,000 | 7.3% |
| 41 | Beaconsfield | 101% | $514,000 | $1,031,000 | $517,000 | 7.2% |
| 42 | Kirkland | 100% | $477,000 | $955,000 | $478,000 | 7.2% |
| 43 | Montreal | 99% | $380,000 | $755,000 | $375,000 | 7.1% |
| 44 | Pointe-Claire | 99% | $375,000 | $745,500 | $370,500 | 7.1% |
| 45 | Quebec City | 92% | $250,000 | $480,000 | $230,000 | 6.7% |
| 46 | Val-d'Or | 86% | $215,500 | $400,000 | $184,500 | 6.4% |
| 47 | Lévis | 84% | $239,000 | $440,000 | $201,000 | 6.3% |
| 48 | Rouyn-Noranda | 76% | $210,000 | $370,000 | $160,000 | 5.8% |
| 49 | Westmount | 65% | $1,375,000 | $2,272,500 | $897,500 | 5.2% |
| 50 | Sept-Îles | 58% | $174,000 | $275,000 | $101,000 | 4.7% |
Source: Centris (Matrix), January to September 2026 and year 2016; compiled by the Loaa & Manseur team on October 13, 2026, aggregates only.
What the ranking says
- The third that rose most (Trois-Rivières, Magog, Saint-Jérôme, Drummondville, Sainte-Thérèse...) is at +134% or more: regional and outer-ring cities that started low, where remote work and Montreal's prices did the rest.
- Percent and dollars do not rank alike: Westmount gained $897,500 with +65%, Trois-Rivières $262,000 with +177%. Expensive cities gain in dollars, affordable ones in percent.
- The 10 cheapest rose 118% in median, the 10 most expensive 105%: the regions' catch-up is the big story of the decade.
- 42 cities out of 50 doubled since 2016; the median of cities went from $261,000 to $610,000.
What it changes for buying or selling
For an owner in a city at the top of the ranking, the gain is made and it is mostly catch-up: your city's price caught up with its more expensive neighbours, and the next decade will not repeat a 177% rise. For a buyer, past gains do not guarantee the future; what matters is today's price against neighbouring cities, and the days on market that say whether demand is still there.
How to read this ranking
Every city in the table has its page in the house appreciation by city series, where the full 2016-2026 series and the method are detailed. Ranks are computed on the 50 cities tracked, not on all of Quebec: a missing city is not unranked, it is not tracked. Values are Centris (Matrix) figures for single-family house sales over January to September 2026; 2016 is the full year. Ties are ordered alphabetically. No new query: only aggregates already published are reordered.
Frequently asked questions
In which city did houses rise the most in Quebec since 2016?
Trois-Rivières: +177% between 2016 and 2026 ($148,000 to $410,000), ahead of Magog (+175%) and Saint-Jérôme (+158%).
How many cities saw their price double in ten years?
42 out of 50. The median gain of cities is +124%, a median price gone from $261,000 to $610,000.
Is the gain stronger in expensive or affordable cities?
In affordable ones: +118% in median for the 10 cheapest cities, +105% for the 10 most expensive. In dollars, it is the reverse.
The nine other rankings of the 2026 Quebec real estate rankings: the cheapest cities, the most expensive cities, the cities where a house sells fastest, the cities where a house sells slowest, the smallest price gains 2016-2026, the cities with the cheapest condos, the cities with the cheapest plex unit, the buyer's markets, the share of sales at a million and up.
Our proof, not our promises
The Loaa & Manseur team, led by Lotfi Manseur and Loaa Al Daow, is the number 1 team at RE/MAX Platine in 2024 and 2025, 6th RE/MAX team in Quebec, 15th in Canada and in the global top 50 of large residential teams according to the official RE/MAX ranking, computed on actual transactions. Its Google profile counts more than 220 reviews with a 4.9 rating. Its offices are at 55 avenue de l'Équinoxe in Brossard, one bridge from the island, and every broker's licence can be checked in the OACIQ public register. Three things to verify yourself before calling us, and to demand of any other broker.
Also available in French: version française de ce guide.
Published September 7, 2026 by the Loaa & Manseur team, the number 1 team at RE/MAX Platine in 2024 and 2025, 6th RE/MAX team in Quebec, 15th in Canada and in the global top 50 according to the official RE/MAX ranking. Tell us about your project.