Negotiation by price range · Westmount · 2026
How much a house is negotiated in Westmount depending on its price: the sold-to-asking ratio by bracket over the past twelve months, the bracket negotiated the most, the one where asking price or more is paid, and what it changes for the seller and the buyer. Centris sales, nothing estimated.
In Westmount, over the past 12 months (October 2025 to September 2026), houses sold at 96% of asking price on a sales-weighted average, 4 points below asking price. But the margin depends on the price: $1M and up, 96% (149 sales). Only the $1M and up bracket has enough sales for a reliable figure in Westmount. No bracket sells at asking or above in Westmount: the buyer gets a margin everywhere, thin or wide depending on the price. It is one of the cities where price changes the margin the least among the 50 tracked (median gap 2.4 points). Source: Centris (Matrix), compiled October 13, 2026.
The short answer
In Westmount, over the past 12 months (October 2025 to September 2026), houses sold at 96% of asking price on a sales-weighted average, 4 points below asking price. But the margin depends on the price: $1M and up, 96% (149 sales). Only the $1M and up bracket has enough sales for a reliable figure in Westmount. No bracket sells at asking or above in Westmount: the buyer gets a margin everywhere, thin or wide depending on the price. It is one of the cities where price changes the margin the least among the 50 tracked (median gap 2.4 points).
Sold price over asking price by price bracket
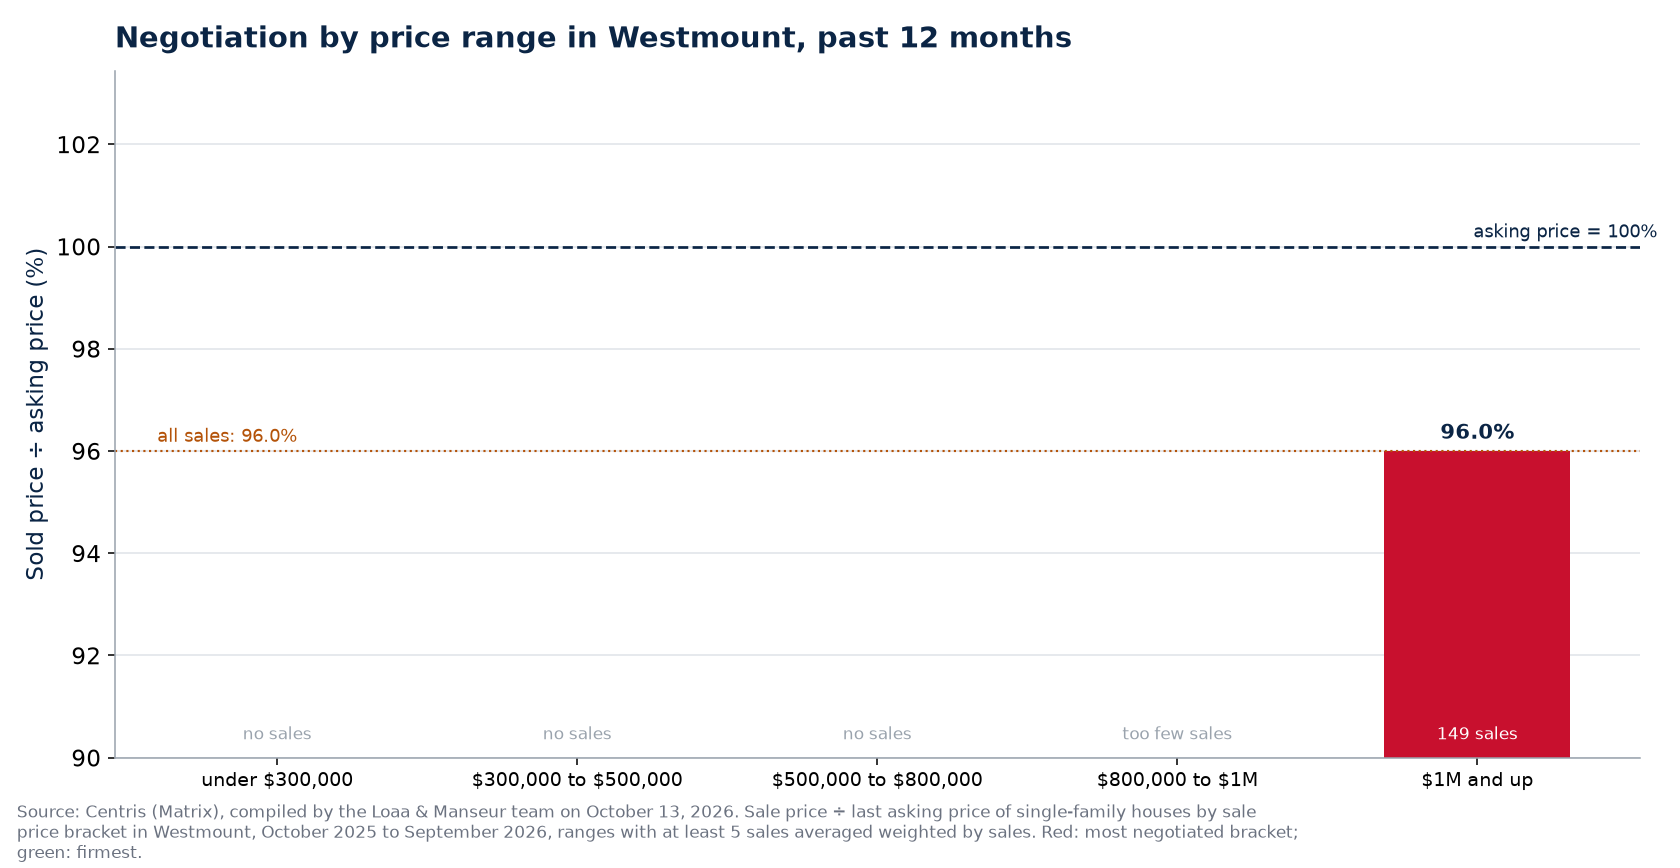
| Price bracket | Sales | Share | Sold price ÷ asking price | Gap (points) |
|---|---|---|---|---|
| under $300,000 | 0 | 0% | no sales | n/a |
| $300,000 to $500,000 | 0 | 0% | no sales | n/a |
| $500,000 to $800,000 | 0 | 0% | no sales | n/a |
| $800,000 to $1M | 3 | 2% | too few sales | n/a |
| $1M and up | 149 | 98% | 96% | −4 |
| All sales | 152 | 100% | 96% | −4 |
Sale price ÷ last asking price (ranges averaged weighted by sales) and number of sales by bracket, Single-family category, past 12 months (October 2025 to September 2026), Centris (Matrix), October 13, 2026 harvest. Gap in points: negative = sold below asking.
Range by range
The fifteen Centris ranges, with the dollar gap computed on the middle of the range (assumption: a house sold at the centre of its range; the open million range has no middle).
| Centris range | Sales | Sold price ÷ asking price | Gap (points) | Gap in dollars (indicative) |
|---|---|---|---|---|
| $900,000 to $1,000,000 | 3 | too few sales | n/a | n/a |
| $1M and up | 149 | 96% | −4 | n/a |
Where buyers negotiate the most in Westmount
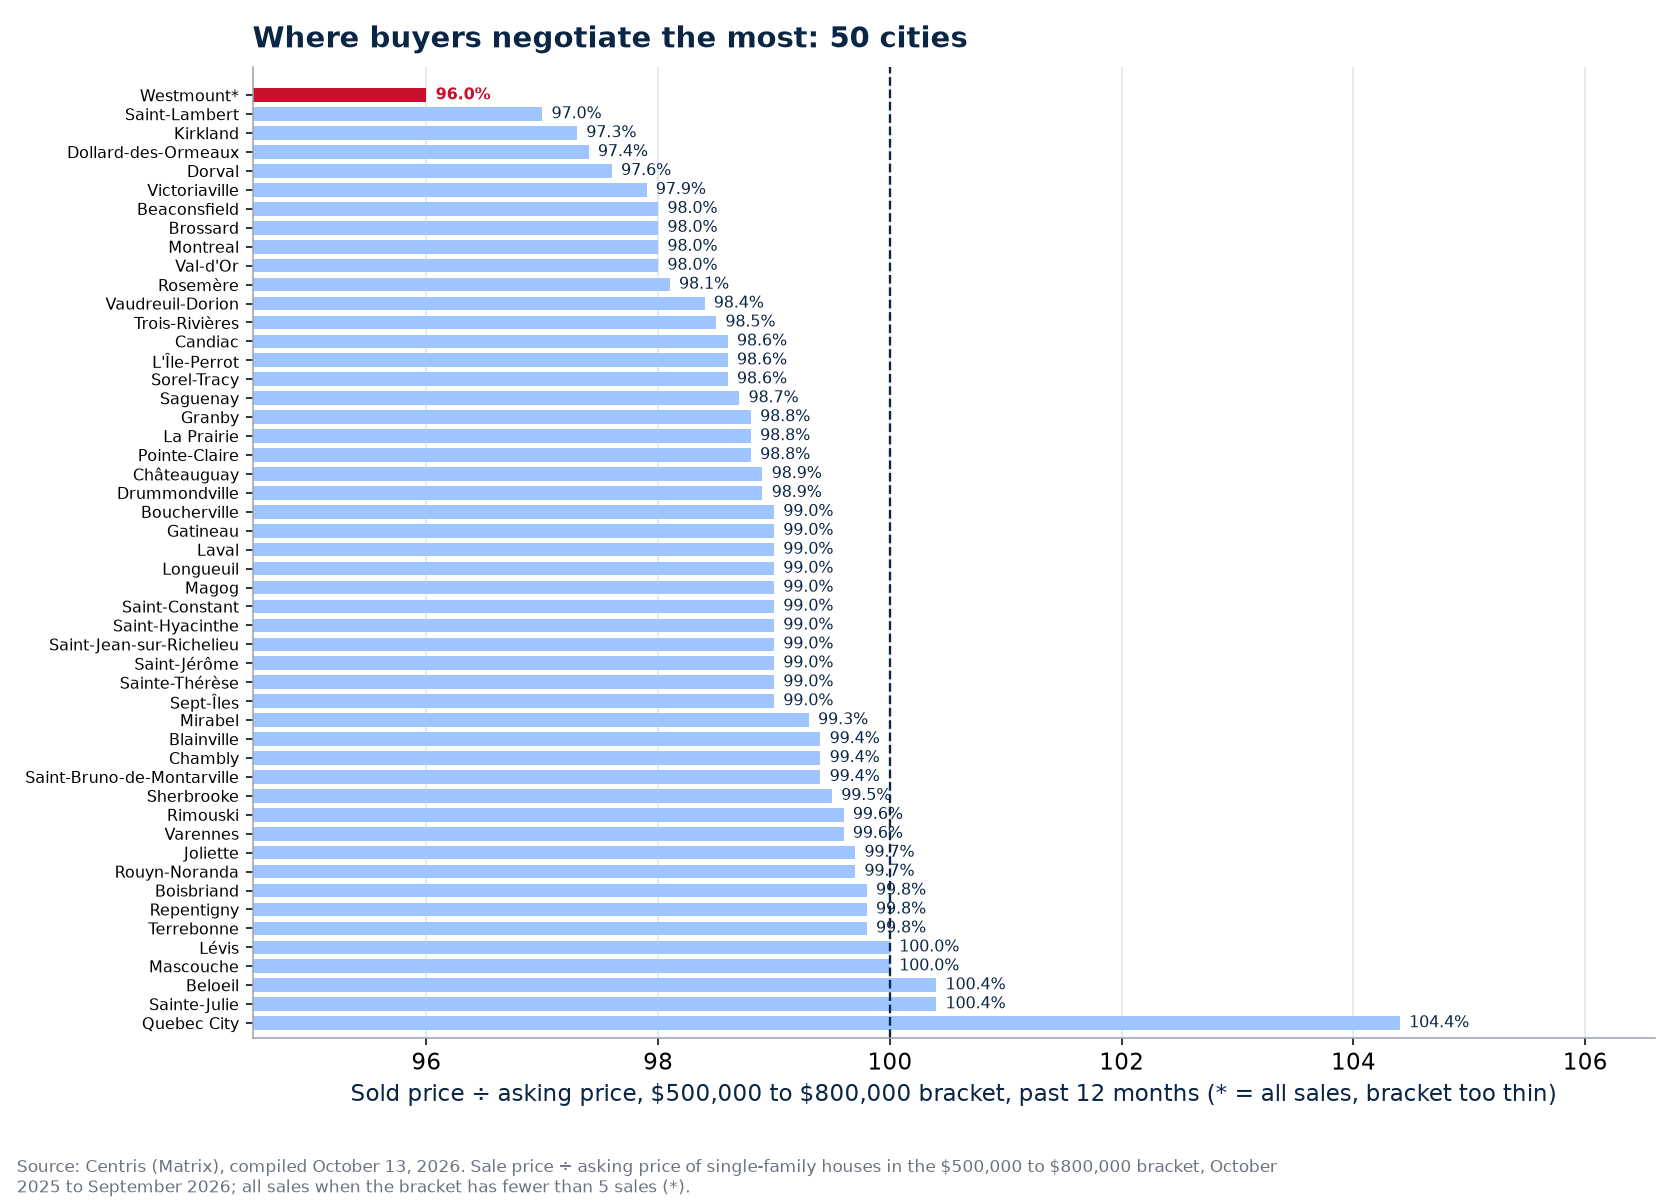
- Where buyers negotiate the most: the $1M and up bracket, at 96% of asking (149 sales); range by range, $1M and up is the most negotiated (96%, 149 sales).
- No published range sells at asking or above in Westmount: the firmest bracket, $1M and up, stays at 96%. The buyer negotiates everywhere; the seller has to build the margin into the asking price.
- Over the year 2026 (January to September), all ranges combined, the ratio was 96% in our ten-year series in Westmount, against 97% at the 2021 peak. The past twelve months (96%) tell the same story, cut by price.
- In dollars: on a house at the 2026 median price in Westmount ($2,272,500), 4 points below asking price is about $90,900 (indicative: the average ratio applied to the median price, not an actual sale).
- Across the 50 cities tracked, the median ratio all sales is 98.8%; by bracket, under $300,000 96.7%; $300,000 to $500,000 98.6%; $500,000 to $800,000 99%; $800,000 to $1M 98.7%; $1M and up 97%. The most negotiated bracket is most often $1M and up (23 cities); at least one bracket sells at asking or above in 7 cities out of 50; the top of the market ($800,000 and up) is negotiated more than the bottom (under $500,000) in 21 of the 35 cities where both can be measured.
What it changes for selling or buying in Westmount
In Westmount, price changes little about negotiation: a 0-point gap between the most negotiated bracket and the firmest, around 96%. The margin is about the same at every price, which is rare: usually the extremes of the market are negotiated more. For a seller, the price is set on comparables and the margin will be the city's; for a buyer, there is no refuge bracket where to negotiate much more than elsewhere. The ratio year by year, all ranges combined, is in sold over asking in Westmount, ten years; days on market by price bracket, in days on market by price in Westmount.
Advice for the seller in Westmount
- Set the asking price on comparable sales in your bracket, not on inventory: in Westmount, the $1M and up bracket gets 96% of asking, the $1M and up bracket 96%. An asking price above comparables draws even lower offers, or none.
- No bracket sells at asking in Westmount: build the margin into the asking price, and decide the floor in advance rather than discovering it in front of the first offer.
- Look at the fine range, not only the bracket: $1M and up is negotiated at 96%. Listings that do not sell are not in this ratio: see houses that do not sell in Westmount.
Advice for the buyer in Westmount
- In the $1M and up bracket, an offer below asking is the norm in Westmount (4 points below asking price on average): start below the price and let the seller come to you.
- Even in the firmest bracket ($1M and up, 96%), there is a margin: aim for the price of comparables rather than the asking price.
- The ratio compares to the last asking price, not the original one: a house that cut its price before selling shows at 98% or 99% even if the buyer paid well under the first listed price. The price-cut history is in the Centris listing; days on market by bracket are in days on market by price in Westmount.
How to read these figures
One Centris (Matrix) query per city: Single-family category, past-12-months period, grouping by sale price, measure sold price vs asking price (ratio) and number of sales by range, whole municipality of Westmount, harvested October 13, 2026. The Matrix ratio is an integer (rounded to the percent) per range; the bracket's ratio is the average of its ranges' ratios weighted by their sales, which gives it one decimal. A range is published only with at least 5 sales, and only published ranges enter the bracket's ratio: a single sale at an unusual price does not move the average.
Frequently asked questions
How much do buyers negotiate on a house in Westmount in 2026?
4 points below asking price on a sales-weighted average in Westmount, a ratio of 96% over the past 12 months (October 2025 to September 2026), about $90,900 on a house at the median price of $2,272,500 (indicative). The margin runs from 96% ($1M and up) to 96% ($1M and up) depending on the bracket.
Which price range is negotiated the most in Westmount?
The $1M and up bracket: 96% of asking, 149 sales; range by range, $1M and up at 96%. Across the 50 cities tracked, the most negotiated bracket is most often $1M and up (23 cities), the firmest $500,000 to $800,000 (28 cities).
Do buyers pay asking price or more in Westmount?
Not on average in Westmount: the firmest bracket, $1M and up, sells at 96% of asking. At least one bracket reaches 100% in 7 cities out of 50; all sales combined, 4 cities do.
Does the ratio account for price cuts before the sale?
No. The ratio compares the sale price to the last asking price, the one in force when the offer came in. A house listed at $650,000, cut to $620,000 then sold at $610,000 shows at 98%, not 94%. The gap between asking price and original price, year by year, is measured in sold over asking in Westmount, ten years.
Sources: Centris (Matrix), Statistics module, October 13, 2026 query for the municipality of Westmount, Single-family category, past-12-months period, grouping by sale price, measure sold price vs asking price (ratio) and number of sales by range; compiled by the Loaa & Manseur team, aggregates only. The negotiation by price range in 50 cities hub compares the 50 cities.
Our proof, not our promises
The Loaa & Manseur team, led by Lotfi Manseur and Loaa Al Daow, is the number 1 team at RE/MAX Platine in 2024 and 2025, 6th RE/MAX team in Quebec, 15th in Canada and in the global top 50 of large residential teams according to the official RE/MAX ranking, computed on actual transactions. Its Google profile counts more than 220 reviews with a 4.9 rating. Its offices are at 55 avenue de l'Équinoxe in Brossard, one bridge from the island, and every broker's licence can be checked in the OACIQ public register. Three things to verify yourself before calling us, and to demand of any other broker.
Also available in French: version française de ce guide.
Published September 7, 2026 by the Loaa & Manseur team, the number 1 team at RE/MAX Platine in 2024 and 2025, 6th RE/MAX team in Quebec, 15th in Canada and in the global top 50 according to the official RE/MAX ranking. Tell us about your project.