Volume by price · La Prairie · 2026
How many dollars of houses change hands in La Prairie and in which price bracket: the share of dollars against the share of sales by range over the past twelve months, the average ticket, the bracket that weighs the most. Centris sales, nothing estimated.
In La Prairie, over the past 12 months (October 2025 to September 2026), 196 houses sold for $153M, an average ticket of $778,264. The money does not follow the count: $300,000 to $500,000, 5% of sales and 2% of the dollars; $500,000 to $800,000, 56% of sales and 48% of the dollars; $800,000 to $1M, 29% of sales and 34% of the dollars; $1M and up, 10% of sales and 16% of the dollars. The $500,000 to $800,000 bracket is both the best-selling and the heaviest in dollars. Houses at $800,000 and up are 39% of sales but 50% of the dollars; under $500,000, 5% of sales for 2% of the dollars. It is one of the cities where the money is most concentrated at the top of the market among the 50 tracked (median 26% of the dollars at $800,000 and up). Source: Centris (Matrix), compiled October 14, 2026.
The short answer
In La Prairie, over the past 12 months (October 2025 to September 2026), 196 houses sold for $153M, an average ticket of $778,264. The money does not follow the count: $300,000 to $500,000, 5% of sales and 2% of the dollars; $500,000 to $800,000, 56% of sales and 48% of the dollars; $800,000 to $1M, 29% of sales and 34% of the dollars; $1M and up, 10% of sales and 16% of the dollars. The $500,000 to $800,000 bracket is both the best-selling and the heaviest in dollars. Houses at $800,000 and up are 39% of sales but 50% of the dollars; under $500,000, 5% of sales for 2% of the dollars. It is one of the cities where the money is most concentrated at the top of the market among the 50 tracked (median 26% of the dollars at $800,000 and up).
Share of dollars and share of sales by price bracket

| Price bracket | Sales | Share of sales | Volume | Share of dollars | Average ticket |
|---|---|---|---|---|---|
| under $300,000 | 0 | 0% | $0 | 0% | no sales |
| $300,000 to $500,000 | 9 | 5% | $4M | 2% | $422,889 |
| $500,000 to $800,000 | 110 | 56% | $73M | 48% | $665,933 |
| $800,000 to $1M | 57 | 29% | $51M | 34% | $900,512 |
| $1M and up | 20 | 10% | $24M | 16% | $1,207,600 |
| All sales | 196 | 100% | $153M | 100% | $778,264 |
Dollar volume (sum of sale prices), number of sales and average ticket by bracket, Single-family category, past 12 months (October 2025 to September 2026), Centris (Matrix), October 13-14, 2026 harvest. Brackets aligned on Centris ranges ($500,000 to $800,000, $800,000 to $1M).
The fine ranges
| Centris range | Sales | Volume | Share of dollars | Average ticket |
|---|---|---|---|---|
| $350,000 to $400,000 | 2 | $742,000 | 0% | n/a |
| $400,000 to $450,000 | 5 | $2M | 1% | $421,800 |
| $450,000 to $500,000 | 2 | $955,000 | 1% | n/a |
| $500,000 to $600,000 | 18 | $10M | 7% | $560,661 |
| $600,000 to $700,000 | 57 | $37M | 24% | $647,714 |
| $700,000 to $800,000 | 35 | $26M | 17% | $749,743 |
| $800,000 to $900,000 | 30 | $26M | 17% | $851,447 |
| $900,000 to $1,000,000 | 27 | $26M | 17% | $955,030 |
| $1M and up | 20 | $24M | 16% | $1,207,600 |
What the split says in La Prairie
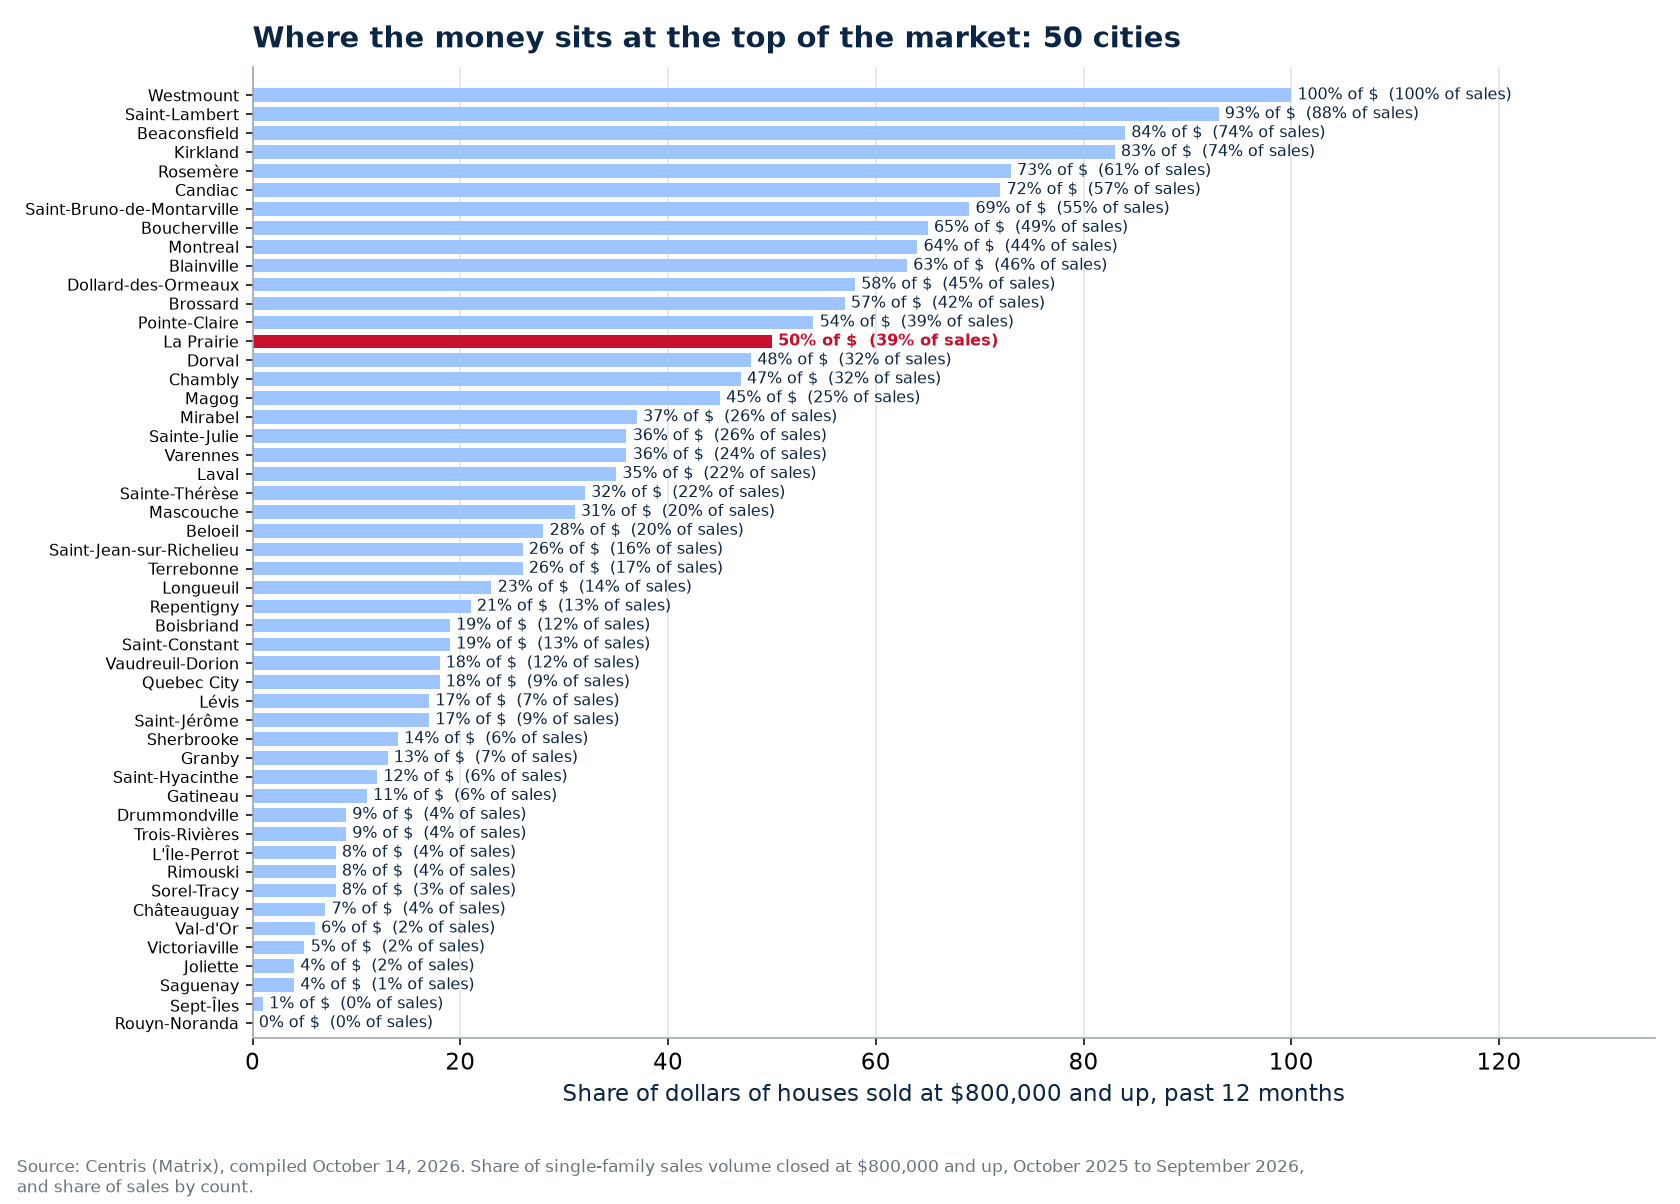
- The heaviest bracket: $500,000 to $800,000 holds 48% of the dollars ($73M) for 56% of sales; the heaviest fine range is $600,000 to $700,000 (24% of the dollars), which is also the best-selling.
- Weighs more in dollars than in count: $1M and up, 16% of the dollars for 10% of sales (6 points). One sale in 10 closes there, but each is worth $1,207,600.
- Weighs more in count than in dollars: $500,000 to $800,000, 56% of sales for 48% of the dollars (−8 points): it is the bracket of transaction volume, not dollar volume.
- The top-of-market lever: each percent of sales at $800,000 and up weighs 1.3 percent of the dollars in La Prairie, against 1.55 in median of the 50 cities.
- Across the 50 cities tracked, houses at $800,000 and up are 16% of sales and 26% of the dollars in median; the million and up, 5% of sales and 10% of the dollars. The heaviest bracket in dollars is most often $500,000 to $800,000 (26 cities), the best-selling $500,000 to $800,000 (29 cities); the two differ in 8 cities, and the million is the first bracket in dollars in 9. Median average ticket: $647,830.
And over ten years: the annual series
The annual series for La Prairie (sales volume in La Prairie) gives $145M for the full year 2025 and $128M for January to September 2026. The twelve months from October 2025 to September 2026 on this page total $153M, or 5% against 2025: the two windows overlap by only three months, so the comparison says whether the money changing hands is rising or falling, not by exactly how much. The average ticket goes from $779,276 in 2025 to $778,264 over the past twelve months (0%). What the annual series does not say and this page shows is the split: how much of the total comes from each bracket.
What it changes for selling or buying in La Prairie
In La Prairie, the money is at the top: 50% of the dollars are decided at $800,000 and up, in 39% of transactions. For a seller in that bracket, every point of negotiation is expensive: on an average ticket of $665,933, one percent is $6,659, and the preparation of the listing is what protects it. For a buyer, it is the bracket where a broker who knows the street's comparable sales makes the difference between asking and paid. The bottom of the market (5% of sales, 2% of the dollars) belongs to first-time buyers: more transactions, fewer dollars per transaction. The number of sales by range, in 2020, 2023 and 2026, is in house sales by price range in La Prairie; days on market by bracket, in days on market by price in La Prairie; negotiation by bracket, in negotiation by price range in La Prairie.
How to read these figures
One table for all of La Prairie, over twelve months, single-family houses only. The volume is the sum of closed sale prices; $153M in La Prairie is what buyers paid in a year, not what the houses are worth. The share of dollars is read with the number of sales beside it: 110 sales in $500,000 to $800,000 give a solid share; a bracket with 9 sales gives an indication. Median prices year by year are in home prices in La Prairie.
Frequently asked questions
How many dollars of houses sell in La Prairie in a year?
$153M of single-family houses sold in La Prairie over the past 12 months (October 2025 to September 2026), in 196 transactions, an average ticket of $778,264.
Which price bracket weighs the most in La Prairie?
$500,000 to $800,000, with 48% of the dollars ($73M). It is also the best-selling bracket by count. Across the 50 cities tracked, the heaviest bracket is most often $500,000 to $800,000 (26 cities).
What do million-dollar houses weigh in La Prairie?
10% of sales and 16% of the dollars in La Prairie, for an average ticket of $1,207,600. Across the 50 cities, the million and up is 5% of sales and 10% of the dollars in median; it is the first bracket in dollars in 9 cities and exceeds half of the dollars in 5.
Are these figures Centris counts or estimates?
Both come from Centris (Matrix): the volume is the sum of closed sale prices by range, the sales their number, over the past twelve months; the average ticket is simply one divided by the other. Nothing is estimated. The comparison with 2025 comes from our annual series, whose window (calendar year) does not coincide with this page's twelve months: it reads as a direction, not a precise measure.
Sources: Centris (Matrix), Statistics module, October 13 and 14, 2026 query for the municipality of La Prairie, Single-family category, past-12-months period, grouping by sale price, dollar volume and number of sales by range; compiled by the Loaa & Manseur team, aggregates only. The where the money goes by price bracket in 50 cities hub compares the 50 cities.
Our proof, not our promises
The Loaa & Manseur team, led by Lotfi Manseur and Loaa Al Daow, is the number 1 team at RE/MAX Platine in 2024 and 2025, 6th RE/MAX team in Quebec, 15th in Canada and in the global top 50 of large residential teams according to the official RE/MAX ranking, computed on actual transactions. Its Google profile counts more than 220 reviews with a 4.9 rating. Its offices are at 55 avenue de l'Équinoxe in Brossard, one bridge from the island, and every broker's licence can be checked in the OACIQ public register. Three things to verify yourself before calling us, and to demand of any other broker.
Also available in French: version française de ce guide.
Published September 7, 2026 by the Loaa & Manseur team, the number 1 team at RE/MAX Platine in 2024 and 2025, 6th RE/MAX team in Quebec, 15th in Canada and in the global top 50 according to the official RE/MAX ranking. Tell us about your project.