Waterfront · Terrebonne · Centris 2018-2026
The median sale price of a house bordered by a body of water in Terrebonne, year by year since 2018, against all houses: what the waterfront costs, whether the premium grows or melts, and the share of waterfront sales. Centris figures, not estimates.
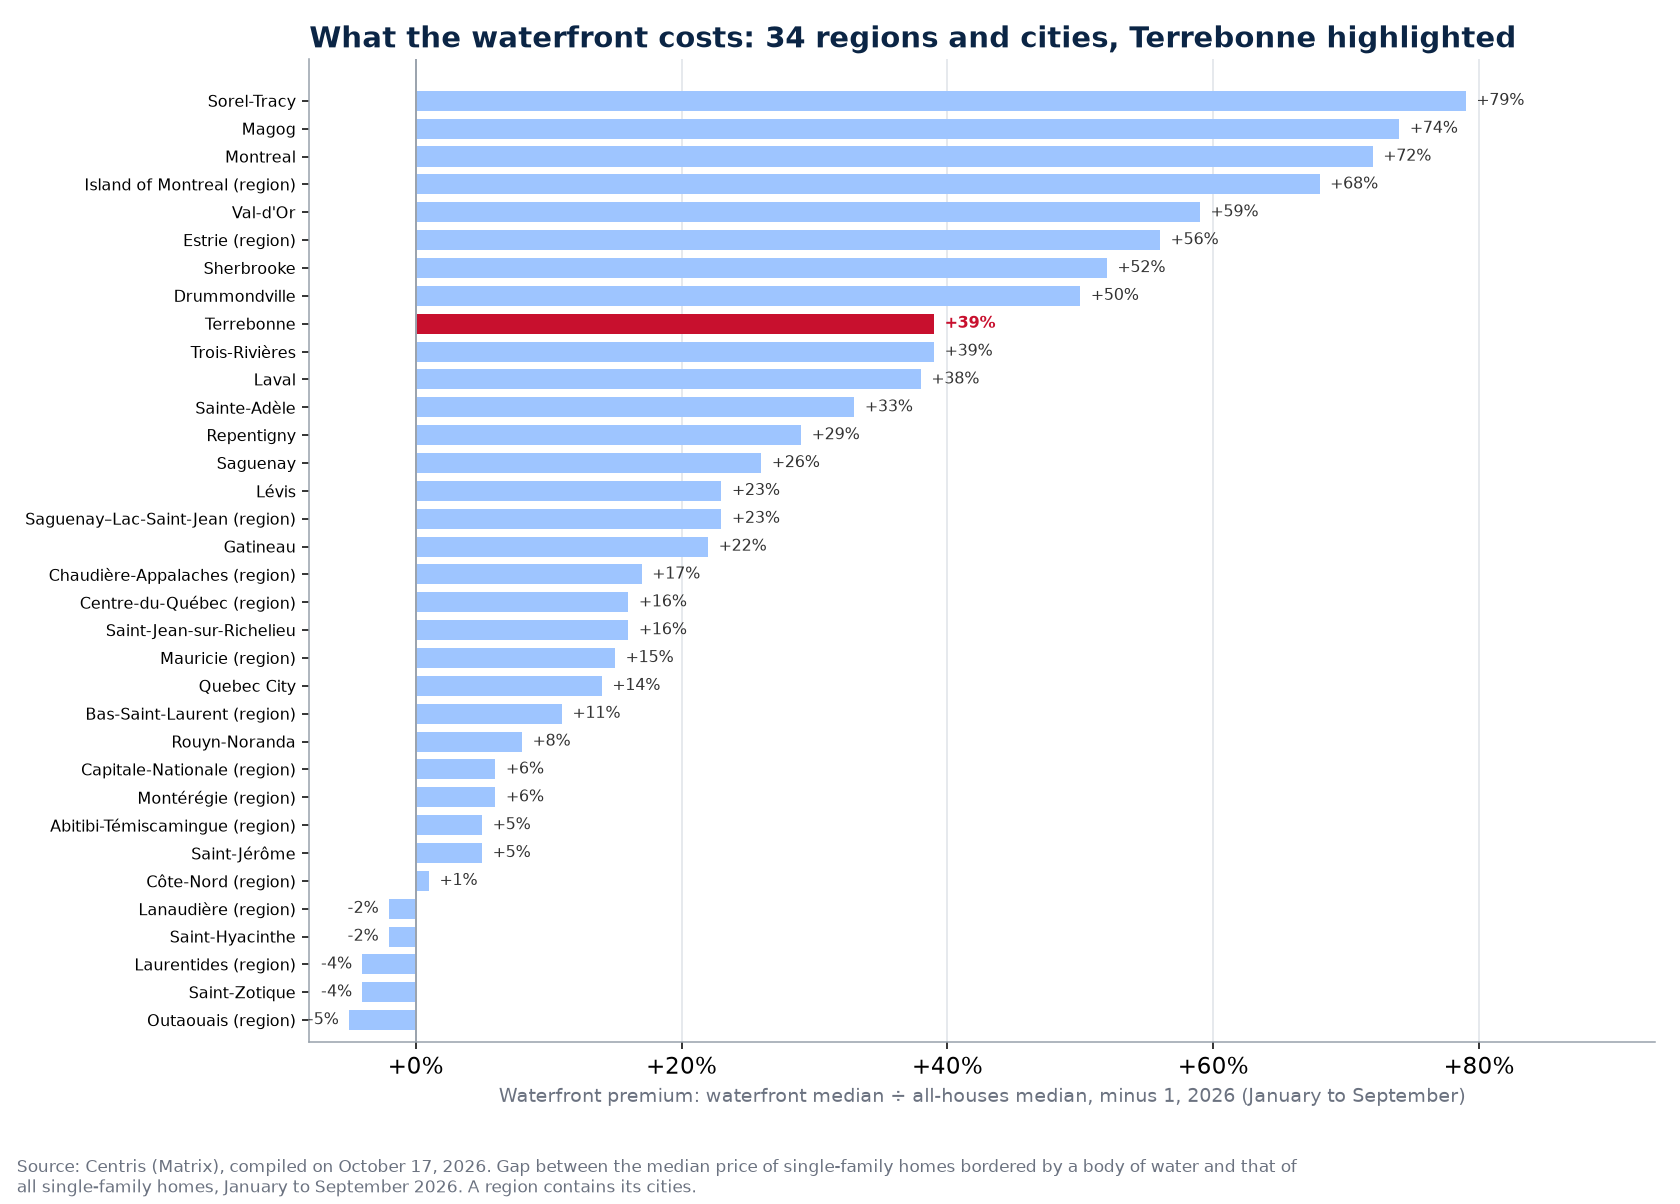
In Terrebonne, the waterfront is expensive: a house bordered by a body of water sells for $830,000 at the median in 2026 (January to September), versus $595,500 for all single-family homes, $234,500 (+39%) more, one of the highest premiums among the 34 regions and cities tracked (rank 9 of 34). 11 houses bordered by a body of water sold in Terrebonne from January to September 2026, 1.3% of single-family sales. Since 2018: waterfront +102%, all houses +113%. Source: Centris (Matrix), compiled on October 17, 2026.
The short answer
In Terrebonne, the waterfront is expensive: a house bordered by a body of water sells for $830,000 at the median in 2026 (January to September), versus $595,500 for all single-family homes, $234,500 (+39%) more, one of the highest premiums among the 34 regions and cities tracked (rank 9 of 34). 11 houses bordered by a body of water sold in Terrebonne from January to September 2026, 1.3% of single-family sales. Since 2018: waterfront +102%, all houses +113%.
Median price, waterfront versus all houses, year by year

| Year | Waterfront, median price | Sales | All houses, median price | Sales | Waterfront premium | Share of sales |
|---|---|---|---|---|---|---|
| 2018 | $410,000 | 18 | $279,550 | 1,284 | +47% | 1.4% |
| 2019 | $325,000 | 17 | $290,000 | 1,364 | +12% | 1.2% |
| 2020 | $431,000 | 33 | $350,000 | 1,543 | +23% | 2.1% |
| 2021 | $682,500 | 27 | $439,000 | 1,225 | +55% | 2.2% |
| 2022 | $809,000 | 15 | $500,000 | 1,048 | +62% | 1.4% |
| 2023 | n/a | 8 | $506,000 | 940 | n/a | 0.9% |
| 2024 | $681,250 | 16 | $535,000 | 1,043 | +27% | 1.5% |
| 2025 | $820,000 | 17 | $582,000 | 1,150 | +41% | 1.5% |
| 2026 (Jan. to Sept.) | $830,000 | 11 | $595,500 | 849 | +39% | 1.3% |
Closed sales on Centris from 2018 to September 2026: 162 houses bordered by a body of water and 10,446 single-family homes in all. A year with fewer than 10 waterfront sales is left blank (n/a). When a year has few sales, its median can move by tens of thousands of dollars without the market having changed.
What nine years of sales say in Terrebonne
- The waterfront rose more slowly than the rest in Terrebonne: +102% since 2018, versus +113% for all houses. The premium narrowed: buyers first caught up on the price of the ordinary house.
- The waterfront premium is stable: +47% in 2018, +39% in 2026 ($234,500 gap at the median).
- The waterfront house sold for more than the median house every publishable year in Terrebonne: the strongest premium in 2022 (+62%), the weakest in 2019 (+12%).
- The waterfront is rare in Terrebonne: 1.6% of single-family homes sold since 2018 (162 of 10,446). A median on so few sales moves a lot from one year to the next: read the trend, not a single year's figure.
- 2026 (January to September) versus 2025: waterfront +1.2% ($820,000 to $830,000), all houses +2.3% ($582,000 to $595,500).
- Peaks: waterfront $830,000 in 2026, all houses $595,500 in 2026. The waterfront fell in 2019, 2024.
- Year without a publishable waterfront median (fewer than 10 sales): 2023.
- Quebec benchmark: across the province, the house bordered by a body of water sells for $510,000 at the median in 2026 (January to September), versus $510,000 for all single-family homes (0%); in Terrebonne, the premium is higher.
Is the waterfront worth paying for in Terrebonne?
In Terrebonne, the waterfront is a different product: $234,500 more at the median (+39%). At that price you are not buying a view, you are buying a category of house: larger, newer, on a wider lot, often with a dock and landscaping. The waterfront seller should know it: the comparables are the other waterfront sales, not the average of the city.
How to read these figures
One median per year for waterfront houses in Terrebonne and one for all houses. Waterfront = the Centris listing reports a body of water bordering the lot (lake, river, the St. Lawrence, pond, canal, sea, reservoir or stream). The gap between the two does not measure what the water is worth for a given house: it measures what the market paid for the typical waterfront house versus the typical house of the city. Fewer than 10 waterfront sales in a year: median left blank. Series from 2018, the year the field appears.
Our other data series in Terrebonne, from the same Centris listings:
- Land prices in Terrebonne, ten years
- Home prices in Terrebonne, ten years
- What the pool and garage are worth in Terrebonne
- Prices by number of bedrooms in Terrebonne
- Prices by number of bathrooms in Terrebonne
Each series is recalculated from actual sales, aggregates only.
Frequently asked questions
How much does a waterfront house cost in Terrebonne in 2026?
$830,000 at the median for a house bordered by a body of water sold in Terrebonne from January to September 2026 (11 sales), versus $595,500 for all single-family homes (849 sales).
What is the waterfront worth in Terrebonne?
$234,500 (+39%) at the 2026 median. In 2018, the premium was +47%. Across the 34 regions and cities tracked, the median premium is 20%, and it is negative in 5 of them.
Did the waterfront gain more value than the rest in Terrebonne?
The waterfront: +102% between 2018 and 2026, versus +113% for all houses in Terrebonne.
What share of sales is waterfront in Terrebonne?
1.6% of single-family homes sold in Terrebonne since 2018 were bordered by a body of water (162 houses of 10,446); 1.3% from January to September 2026.
Source: Centris (Matrix), Statistics module, queries run on October 17, 2026 for all of Terrebonne: single-family category, criterion "Type plan d'eau - bordé" (all types), then no criterion, median sale price and number of sales per year over ten years; the field has been filled in only since 2018; compiled by the Loaa & Manseur team, aggregates only, 2026 = January to September. Past performance is no guarantee of future results.
Also available in French: version française de ce guide.
Published September 7, 2026 by the Loaa & Manseur team, the number 1 team at RE/MAX Platine in 2024 and 2025, 6th RE/MAX team in Quebec, 15th in Canada and in the global top 50 according to the official RE/MAX ranking. Tell us about your project.