Longueuil or Saint-Lambert · city matchup · 2016-2026
Longueuil versus Saint-Lambert, figure by figure: the median price of houses and condos every year since 2016, the gap and how it moved, days on market, inventory, bidding, unsold listings and the monthly payment. Centris sales, nothing estimated.
In Longueuil, the median house sold for $602,000 in 2026 (Jan. to Sept.); in Saint-Lambert, $1,120,000: a $518,000 gap, Longueuil is the cheaper of the two (46% less). In 2016, the gap was $284,250 (51%): it has narrowed. In ten years, Longueuil did +123% and Saint-Lambert +102%. In the 2026 market, a house sells in 11 days in Longueuil against 17 days in Saint-Lambert, inventory stands at 2.7 months versus 4.5 months of sales, houses go for 99% versus 97% of asking, and 19% versus 30% of listings expire unsold. The tighter market for a buyer is Longueuil (4 indicators out of 4). Source: Centris (Matrix), compiled October 10, 2026.
The short answer
In Longueuil, the median house sold for $602,000 in 2026 (Jan. to Sept.); in Saint-Lambert, $1,120,000: a $518,000 gap, Longueuil is the cheaper of the two (46% less). In 2016, the gap was $284,250 (51%): it has narrowed. In ten years, Longueuil did +123% and Saint-Lambert +102%. In the 2026 market, a house sells in 11 days in Longueuil against 17 days in Saint-Lambert, inventory stands at 2.7 months versus 4.5 months of sales, houses go for 99% versus 97% of asking, and 19% versus 30% of listings expire unsold. The tighter market for a buyer is Longueuil (4 indicators out of 4).
Median house and condo prices, ten years side by side
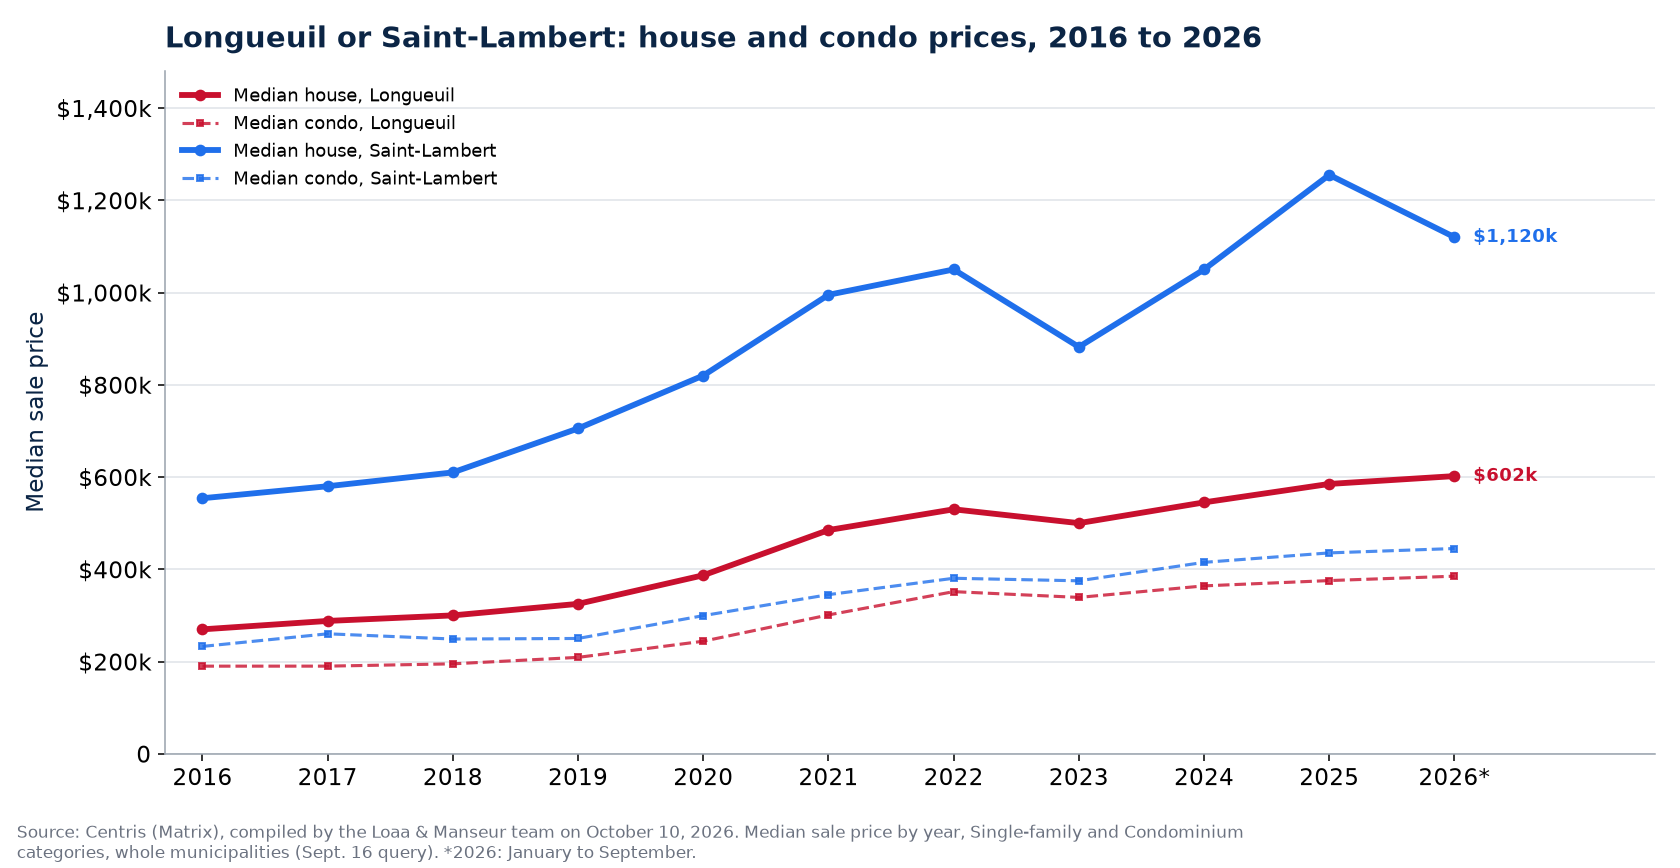
| Year | House Longueuil | House Saint-Lambert | Gap | Condo Longueuil | Condo Saint-Lambert |
|---|---|---|---|---|---|
| 2016 | $269,750 | $554,000 | $284,250 | $189,950 | $232,750 |
| 2017 | $288,000 | $580,000 | $292,000 | $190,000 | $260,100 |
| 2018 | $300,000 | $610,000 | $310,000 | $194,995 | $248,750 |
| 2019 | $325,000 | $705,250 | $380,250 | $209,000 | $250,000 |
| 2020 | $387,000 | $820,000 | $433,000 | $244,000 | $299,500 |
| 2021 | $485,000 | $995,000 | $510,000 | $301,000 | $345,000 |
| 2022 | $530,000 | $1,050,000 | $520,000 | $351,500 | $380,500 |
| 2023 | $500,000 | $881,944 | $381,944 | $339,000 | $375,000 |
| 2024 | $545,000 | $1,050,000 | $505,000 | $364,000 | $415,000 |
| 2025 | $585,000 | $1,255,000 | $670,000 | $375,500 | $435,500 |
| 2026 (Jan. to Sept.) | $602,000 | $1,120,000 | $518,000 | $385,000 | $445,000 |
Median sale price by year, Single-family and Condominium categories, Centris (Matrix), September 16, 2026 query, whole municipalities. 2026: January to September.
Ten indicators, city against city
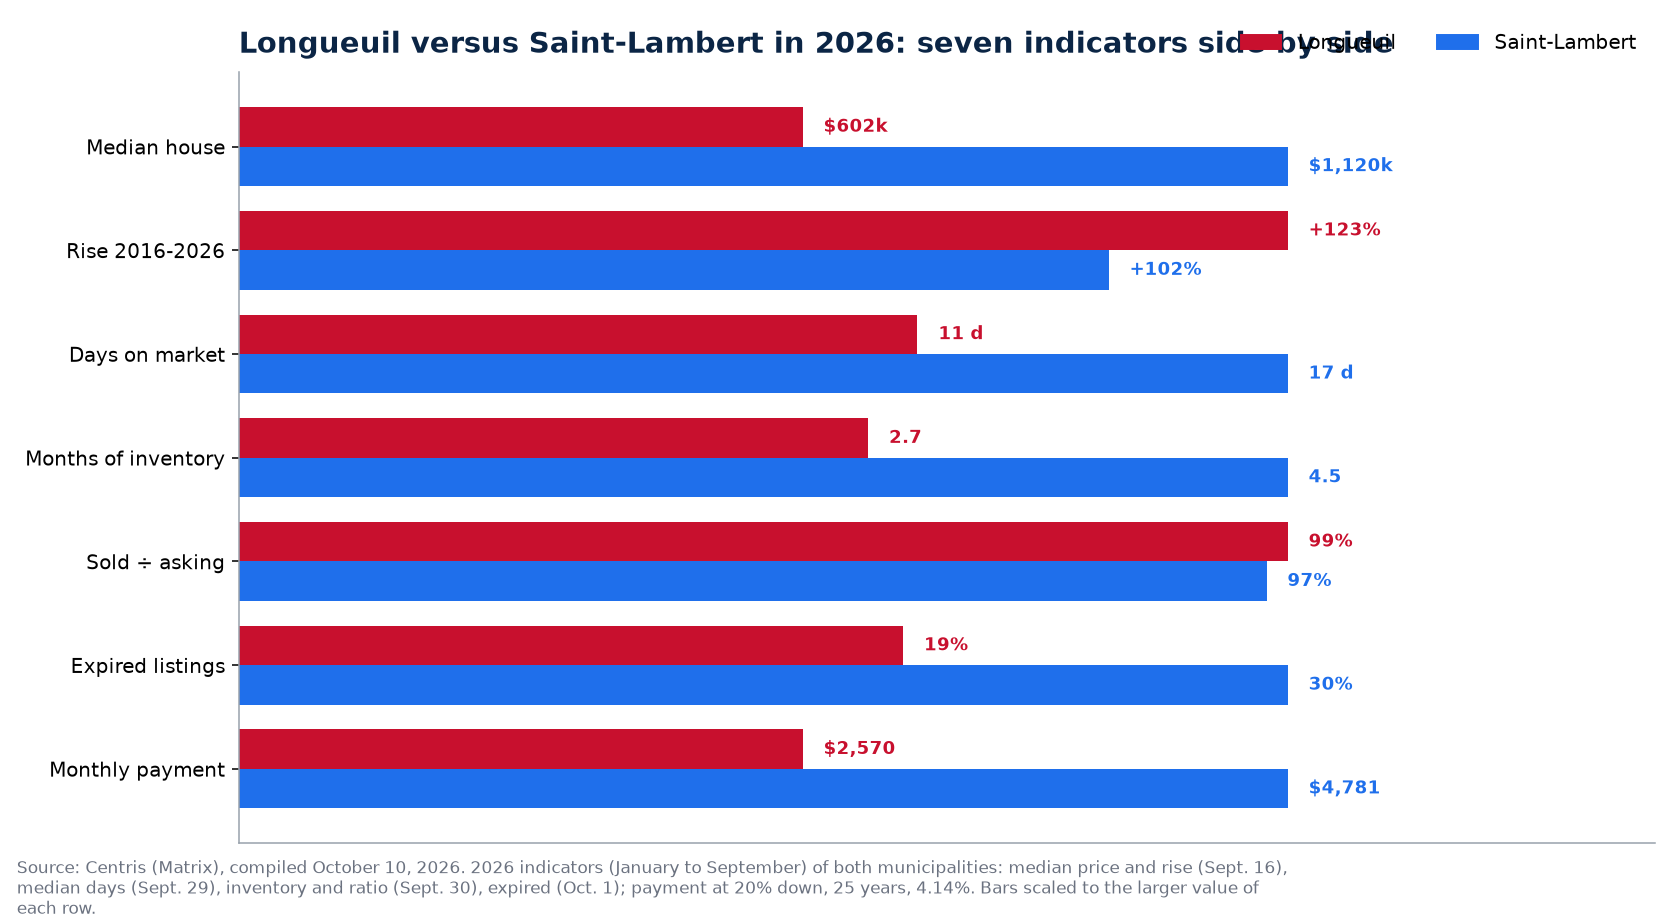
| Indicator | Longueuil | Saint-Lambert | Edge |
|---|---|---|---|
| Median house 2026 | $602,000 | $1,120,000 | Longueuil (cheaper) |
| Increase 2016-2026 | +123% | +102% | Longueuil (rises faster) |
| Median condo 2026 | $385,000 | $445,000 | Longueuil (cheaper) |
| House sales 2025 | 1,369 | 150 | Longueuil (more choice) |
| Days on market 2026 | 11 days | 17 days | Longueuil (sells faster) |
| Months of inventory 2026 | 2.7 months | 4.5 months | Longueuil (tighter) |
| Sold ÷ asking 2026 | 99% | 97% | Longueuil (more bidding) |
| Expired listings 2026 | 19% | 30% | Longueuil (fewer unsold) |
| Monthly payment, median house, 20% down, 25 years, 4.14% | $2,570 | $4,781 | Longueuil (cheaper per month) |
| 20% down payment | $120,400 | $224,000 | Longueuil (less savings) |
What the matchup says
- Price: $518,000 separate the two median houses in 2026, $2,211 a month in payments at 20% down. Saint-Lambert costs 46% more; in 2016, it was 51%: the cheaper city is catching up.
- Speed: Longueuil sells in 11 days against 17 days in Saint-Lambert; in 2016, 51 days against 53 days. Longueuil is the faster.
- Supply: 1,369 houses sold in 2025 in Longueuil against 150 in Saint-Lambert; 2.7 months versus 4.5 months of inventory (5.4 months and 6.8 months in 2016). Longueuil offers more choice, Longueuil is the tighter.
- Negotiation: houses sell at 99% of asking in Longueuil and 97% in Saint-Lambert (in 2021, 106% and 99%); 19% and 30% of listings expire unsold.
- Condos: $385,000 in Longueuil against $445,000 in Saint-Lambert in 2026 (+103% and +91% since 2016); Longueuil is the cheaper for a condo.
- Across the 63 neighbouring-city matchups tracked, the median gap between two median houses is $110,000 (17%); the cheaper city rose faster than the other in 37 matchups, it is also the tighter in 39, and the gap narrowed in 40.
What it changes for buying or selling
The hierarchy of the two cities has held for ten years, Saint-Lambert on top, but the gap moved: from 51% to 46%, the cheaper city is catching up, a sign that buyers are discovering it and accepting to pay. For a buyer, the choice is not only price: Longueuil sells faster, Longueuil has less inventory, and that is where an offer must come in the first week. For a seller, the comparable is their own city; the neighbour helps understand where buyers can go if the price is too high. Each city's ten years, year by year: home prices in Longueuil and home prices in Saint-Lambert.
How to read these figures
Every line comes from the same Centris (Matrix) series as our city pages: median sale price and sales of single-family houses and condominiums by year (September 16, 2026 query), median days on market (September 29 query), new listings and inventory (September 30), sold-to-asking ratio (September 30), expired listings (October 1), whole municipalities; 2026 counts January to September. The monthly payment assumes 20% down, 25 years and the 2026 average contracted rate (4.14%), before taxes and insurance. The condo is shown only if the city has at least 20 sales in 2026. Months of inventory divide active listings by the month's sales; under 4, a seller's market, above 6, a buyer's market.
Frequently asked questions
Longueuil or Saint-Lambert: which is cheaper?
Longueuil: $602,000 for the median house in 2026 against $1,120,000 in Saint-Lambert, or $518,000 less (46%). For a condo, Longueuil is the cheaper ($385,000).
Which one rose the most?
Longueuil: +123% in ten years against +102% for the other. Since 2021, Longueuil +24% and Saint-Lambert +13%.
Where do houses sell the fastest?
Longueuil: 11 days in Longueuil against 17 days in Saint-Lambert in 2026, 2.7 months versus 4.5 months of inventory. Longueuil is the tighter market for a buyer.
Sources: Centris (Matrix), Statistics module, September 16, 29 and 30 and October 1, 2026 queries for the municipalities of Longueuil and Saint-Lambert, Single-family and Condominium categories; 2026 five-year contracted rate, Bank of Canada and Statistics Canada; compiled by the Loaa & Manseur team, aggregates only, current year partial. The 63 city matchups hub lists every comparison.
Our data series in Longueuil, from the same Centris listings:
- Real estate statistics in Longueuil 2026, 12 indicators and the rank
- Buyer's or seller's market in Longueuil
- Mortgage payment on the median house in Longueuil, ten years
- How long to sell in Longueuil, ten years
- Condo prices in Longueuil, ten years
Each series is recalculated from actual sales, aggregates only.
The other Longueuil matchups:
- Brossard or Longueuil: median house $734,200 versus $602,000 in 2026, $132,200 gap, Longueuil the cheaper, 24 versus 11 days on market, ten years side by side
- Boucherville or Longueuil: median house $810,000 versus $602,000 in 2026, $208,000 gap, Longueuil the cheaper, 10 versus 11 days on market, ten years side by side
- Montreal or Longueuil: median house $755,000 versus $602,000 in 2026, $153,000 gap, Longueuil the cheaper, 20 versus 11 days on market, ten years side by side
Same grid, another neighbour.
Our data series in Saint-Lambert, from the same Centris listings:
- Real estate statistics in Saint-Lambert 2026, 12 indicators and the rank
- Buyer's or seller's market in Saint-Lambert
- Mortgage payment on the median house in Saint-Lambert, ten years
- How long to sell in Saint-Lambert, ten years
- Condo prices in Saint-Lambert, ten years
Each series is recalculated from actual sales, aggregates only.
The other Saint-Lambert matchups:
- Brossard or Saint-Lambert: median house $734,200 versus $1,120,000 in 2026, $385,800 gap, Brossard the cheaper, 24 versus 17 days on market, ten years side by side
- Saint-Bruno-de-Montarville or Saint-Lambert: median house $819,500 versus $1,120,000 in 2026, $300,500 gap, Saint-Bruno-de-Montarville the cheaper, 8 versus 17 days on market, ten years side by side
Same grid, another neighbour.
Our proof, not our promises
The Loaa & Manseur team, led by Lotfi Manseur and Loaa Al Daow, is the number 1 team at RE/MAX Platine in 2024 and 2025, 6th RE/MAX team in Quebec, 15th in Canada and in the global top 50 of large residential teams according to the official RE/MAX ranking, computed on actual transactions. Its Google profile counts more than 220 reviews with a 4.9 rating. Its offices are at 55 avenue de l'Équinoxe in Brossard, one bridge from the island, and every broker's licence can be checked in the OACIQ public register. Three things to verify yourself before calling us, and to demand of any other broker.
Also available in French: version française de ce guide.
Published September 7, 2026 by the Loaa & Manseur team, the number 1 team at RE/MAX Platine in 2024 and 2025, 6th RE/MAX team in Quebec, 15th in Canada and in the global top 50 according to the official RE/MAX ranking. Tell us about your project.