Expired listings · Sainte-Julie · Centris 2016-2026
How many homes listed in Sainte-Julie go back without a buyer, year by year since 2016: expired listings, the failure rate against sales, average days next to median days, and what today's rate tells a seller about the starting price. Centris figures, not estimates.
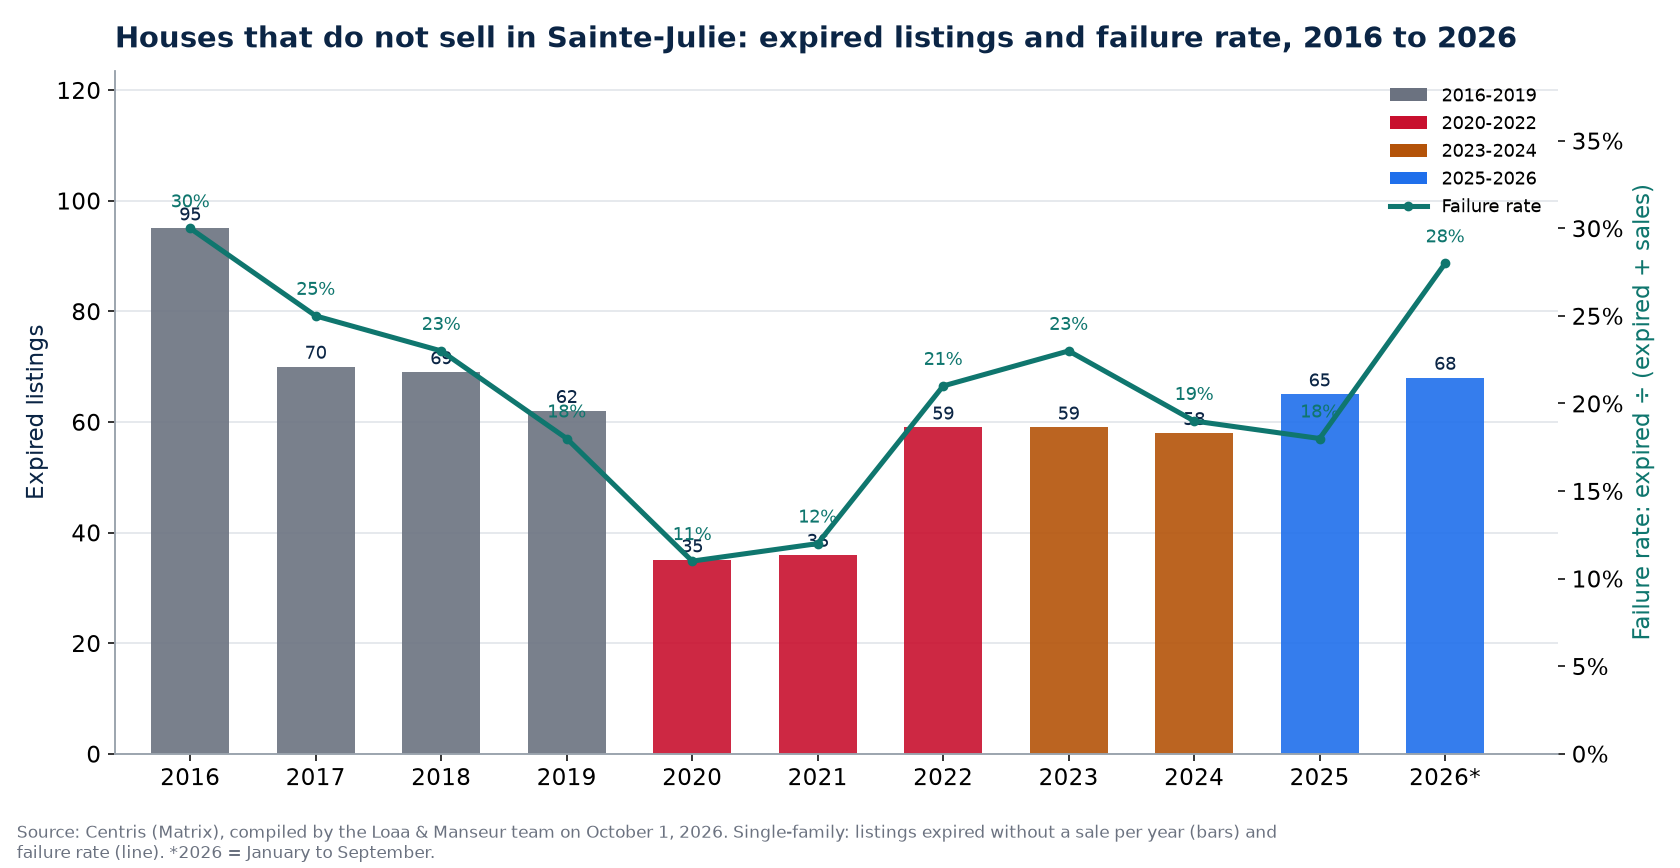
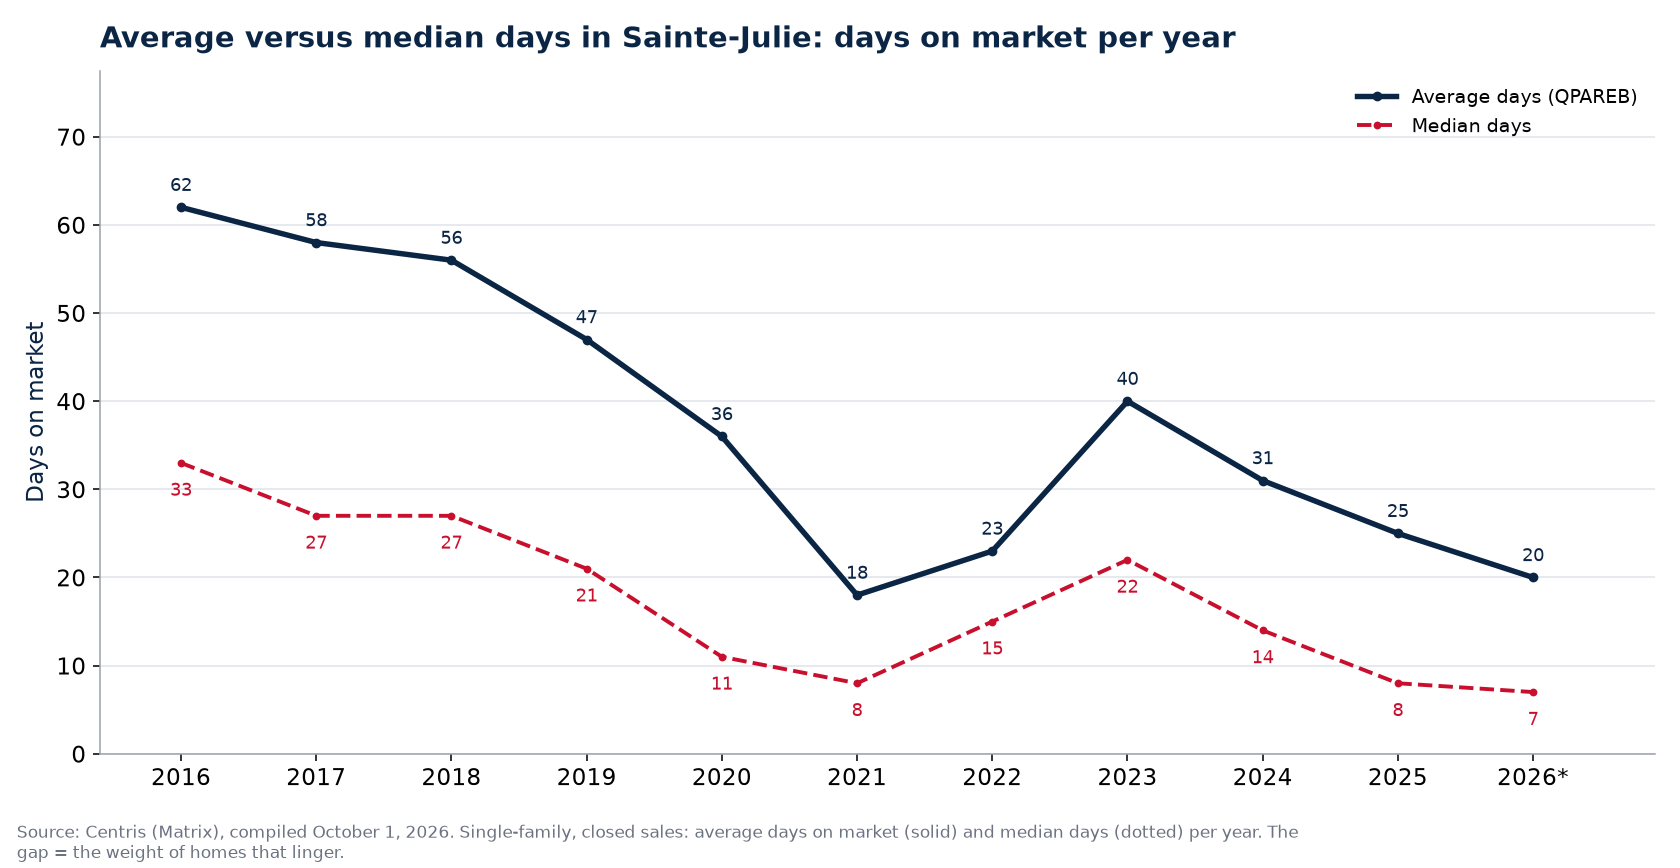
In Sainte-Julie, 65 house listings expired without a sale in 2025, against 95 in 2016 (-32%). Relative to sales, 18% of the listings that ended in 2025 ended without a sale, against 30% in 2016 and 12% at the 2021 trough. In 2026 (Jan. to Sep.), the rate is 28%, one of the highest among the 50 cities tracked (median 21%). Average days on market went from 62 days in 2016 to 18 days in 2021 and 20 days in 2026, against 7 days at the median: the gap between the two is the weight of the houses that linger. Source: Centris (Matrix), compiled October 1, 2026.
The short answer
In Sainte-Julie, 65 house listings expired without a sale in 2025, against 95 in 2016 (-32%). Relative to sales, 18% of the listings that ended in 2025 ended without a sale, against 30% in 2016 and 12% at the 2021 trough. In 2026 (Jan. to Sep.), the rate is 28%, one of the highest among the 50 cities tracked (median 21%). Average days on market went from 62 days in 2016 to 18 days in 2021 and 20 days in 2026, against 7 days at the median: the gap between the two is the weight of the houses that linger.
Expired listings, sales and failure rate per year
| Year | Expired listings | Sales | Failure rate | New listings | Average days | Median days |
|---|---|---|---|---|---|---|
| 2016 | 95 | 225 | 30% | 326 | 62 | 33 |
| 2017 | 70 | 208 | 25% | 297 | 58 | 27 |
| 2018 | 69 | 233 | 23% | 328 | 56 | 27 |
| 2019 | 62 | 287 | 18% | 348 | 47 | 21 |
| 2020 | 35 | 284 | 11% | 308 | 36 | 11 |
| 2021 | 36 | 261 | 12% | 283 | 18 | 8 |
| 2022 | 59 | 223 | 21% | 331 | 23 | 15 |
| 2023 | 59 | 203 | 23% | 284 | 40 | 22 |
| 2024 | 58 | 251 | 19% | 352 | 31 | 14 |
| 2025 | 65 | 291 | 18% | 360 | 25 | 8 |
| 2026 (Jan. to Sep.) | 68 | 177 | 28% | 291 | 20 | 7 |
Single-family category, whole municipality of Sainte-Julie, Centris (Matrix). Failure rate: expired ÷ (expired + sales) of the same year. New listings: January to August for 2026. 2026: nine months for expired listings.
What ten years of expired listings say in Sainte-Julie
- Four markets in ten years in Sainte-Julie: 24% failure on average in 2016-2019, 15% during the 2020-2022 frenzy, 21% when high rates returned, 23% today. Average days: 56, 26, 36 and 22.
- Peak of expired listings: 2016 (95); trough: 2020 (35), -63% between the two. Highest failure rate: 2016 (30%); lowest: 2020 (11%).
- The return of high rates: 12% failure in 2021, 23% in 2023, 18% in 2025. The market regained selectivity without returning to 2016.
- On the year's new listings: 29% of homes listed in 2016 saw their listing expire the same year, 18% in 2025. Fewer than one home in five ends up expired within the year.
- Average versus median: 62 days against 33 days in 2016, 20 days against 7 days in 2026. The gap (29 then 13 days) measures the weight of houses lingering for months: it has shrunk.
- 2026 (Jan. to Sep.) versus 2025: 18% then 28% failure (the rate is climbing: more overpriced homes are left on the shelf); 68 expired in nine months, or 91 at an annual pace (+40%, a simple projection). Across the 50 cities, the rate is climbing in 2026 in 36.
- Ten years: 676 expired listings against 2,643 sales in Sainte-Julie.
What it changes when selling or buying in Sainte-Julie
At 28% failure, Sainte-Julie is a city where listing too high is costly: nearly one listing in four ends without a sale, and a home that expires comes back on the market with a history and a price to cut. For a seller, the starting price should be that of the latest comparable sales, not the municipal assessment or the neighbour who sold in 2021. For a buyer, homes listed for more than 30 days are the ones where negotiation has a chance. The past twelve months' withdrawn listings, one by one, and the asking price they showed are in houses that do not sell in Sainte-Julie.
How to read these figures
One count per year for all of Sainte-Julie: what expires, what sells, and how long sales take, on average and at the median. Expired listings are the visible part of homes that do not sell; withdrawals and cancellations add to them, and our page houses that do not sell in Sainte-Julie counts them over twelve months. The mean days on market is pulled up by homes that linger; the median tells the story of the typical home. Small cities move by a few expired listings from one year to the next: read the plateaus.
Frequently asked questions
How many houses do not sell in Sainte-Julie?
65 single-family house listings expired without a sale in Sainte-Julie in 2025, for 291 sales: a failure rate of 18%. In 2026 (Jan. to Sep.): 68 expired, 28%.
Is the number of unsold homes climbing in Sainte-Julie?
Yes: 28% in 2026 against 18% in 2025 and 12% at the 2021 trough. We remain far from the 30% of 2016, but the trend is up, as in 36 of 50 cities.
Why is the average longer than the median in Sainte-Julie?
Because the average (20 days in 2026) counts homes that linger for months, and the median (7 days) tells the story of the middle home. The 13-day gap is the weight of overpriced homes.
Source: Centris (Matrix), Statistics module, queries of October 1, 2026 for the municipality of Sainte-Julie: Single-family category, expired listings and average days on market by year over ten years; sales from the September 16, 2026 query, new listings from September 30, median days from September 29; compiled by the Loaa & Manseur team, aggregates only, current year partial. The expired listings in 50 cities hub compares the 50 cities.
Our other data series in Sainte-Julie, from the same Centris listings:
- Buyer's or seller's market in Sainte-Julie
- How much buyers negotiate in Sainte-Julie
- Home prices in Sainte-Julie, ten years
Each series is recalculated from actual sales, aggregates only.
And the average house price in Sainte-Julie:
Mean, median and asking price, year by year, ten years from the same Centris listings.
And the sales volume in Sainte-Julie:
How many dollars change hands each year, and whether price or the number of sales rose, ten years from the same Centris listings.
And house appreciation in Sainte-Julie:
What a house bought in each year since 2016 is worth today, ten years from the same Centris listings.
And the jump from condo to house in Sainte-Julie:
The gap between house and condo year by year, and how much of it the condo's gain covers, ten years from the same Centris listings.
All the statistics in Sainte-Julie at a glance:
Twelve 2026 Centris indicators, the city's rank on each, and a link to ten years of detail.
And the down payment to buy in Sainte-Julie:
The minimum, the 20%, the CMHC premium and what the FHSA covers, computed on the 2026 median price.
And the number of condos for sale in Sainte-Julie:
Condominium inventory and new listings per year, ten years from the same Centris listings, condo versus house.
And the best month to sell in Sainte-Julie:
Sales and prices by month over ten years, from the same Centris listings.
And the condos that do not sell in Sainte-Julie:
Expired condo listings and failure rate, year by year, ten years from the same Centris listings.
And the best month to sell a condo in Sainte-Julie:
Condo sales and prices by month over ten years, from the same Centris listings.
And condo sale versus asking price in Sainte-Julie:
Condo sold ÷ asking ratio, year by year, ten years from the same Centris listings.
And the mortgage payment on the median house in Sainte-Julie:
The year's Centris price × the year's 5-year rate charged, 20% down, 25 years, ten years year by year.
And house prices in Sainte-Julie adjusted for inflation:
The year's Centris price in 2026 dollars (Quebec CPI), posted versus real increase, ten years year by year.
And the mortgage payment on the median condo in Sainte-Julie:
The year's Centris price × the year's 5-year rate charged, 20% down, 25 years, ten years year by year.
Sainte-Julie against its neighbours, the matchups:
- Sainte-Julie or Varennes: median house $667,400 versus $631,000 in 2026, $36,400 gap, Varennes the cheaper, 7 versus 9 days on market, ten years side by side
- Sainte-Julie or Saint-Bruno-de-Montarville: median house $667,400 versus $819,500 in 2026, $152,100 gap, Sainte-Julie the cheaper, 7 versus 8 days on market, ten years side by side
The same Centris series, two cities side by side, year by year.
And semi-detached and row house prices in Sainte-Julie:
Median price by house type, year by year, ten years from the same Centris listings.
And houses under $500,000 in Sainte-Julie:
Sales under the threshold and share of sales, year by year, ten years from the same Centris listings.
And houses over $1 million in Sainte-Julie:
Sales at $1M and up and share of sales, year by year, ten years from the same Centris listings.
And sales by price range in Sainte-Julie:
Distribution of sales by bracket in 2020, 2023 and 2026, from the same Centris listings.
And days on market by price in Sainte-Julie:
Median days by price bracket over twelve months, from the same Centris listings.
And prices by lot size in Sainte-Julie:
Small lot versus large lot, year by year, ten years from the same Centris listings.
And condo sales volume in Sainte-Julie:
Dollars sold, sales and average price, year by year, ten years from the same Centris listings.
And the average condo price in Sainte-Julie:
Average, median and asking price, year by year, ten years from the same Centris listings.
And condo days on market by price in Sainte-Julie:
Median condo days by price bracket over twelve months, from the same Centris listings.
And what sells at what price in Sainte-Julie, house, condo or plex:
2026 sales by price range and category, from the same Centris listings.
And which sells fastest in Sainte-Julie at the same price:
Days on market by range and category over twelve months, from the same Centris listings.
And condo sales by price range in Sainte-Julie:
Distribution of condo sales by bracket in 2020 and 2026, from the same Centris listings.
And the market in Sainte-Julie this month:
The past twelve months, month by month, from the same Centris listings.
And what the welcome tax costs on that house in Sainte-Julie:
Welcome tax on each year's median house, city's 2026 grid, first-time buyer credit.
And houses that linger by price range in Sainte-Julie:
Average and median days on market by price range over twelve months, from the same Centris listings.
And maison negotiation by price in Sainte-Julie:
Sold-to-asking ratio by price bracket over twelve months, from the same Centris listings.
And condo negotiation by price in Sainte-Julie:
Sold-to-asking ratio by price bracket over twelve months, from the same Centris listings.
And where the money goes by price bracket in Sainte-Julie:
Share of dollars and share of sales by price range over twelve months, from the same Centris listings.
And price cuts before the sale by price range in Sainte-Julie:
Sold-to-original and sold-to-asking ratios by price range over twelve months, from the same Centris listings.
What is your house worth in Sainte-Julie?
Median price by type, bedrooms, year built and garage, 2026 trend, days on market and free home evaluation.
Our proof, not our promises
The Loaa & Manseur team, led by Lotfi Manseur and Loaa Al Daow, is the number 1 team at RE/MAX Platine in 2024 and 2025, 6th RE/MAX team in Quebec, 15th in Canada and in the global top 50 of large residential teams according to the official RE/MAX ranking, computed on actual transactions. Its Google profile counts more than 220 reviews with a 4.9 rating. Its offices are at 55 avenue de l'Équinoxe in Brossard, one bridge from the island, and every broker's licence can be checked in the OACIQ public register. Three things to verify yourself before calling us, and to demand of any other broker.
Also available in French: version française de ce guide.
Published September 7, 2026 by the Loaa & Manseur team, the number 1 team at RE/MAX Platine in 2024 and 2025, 6th RE/MAX team in Quebec, 15th in Canada and in the global top 50 according to the official RE/MAX ranking. Tell us about your project.