Where the money goes · Saint-Hyacinthe · 2016-2026
The sales dollars in Saint-Hyacinthe every year since 2016, split between houses, condos and plexes: which category weighs the most, which grew the most, and what it changes for selling or buying. Centris sales, nothing estimated.
In Saint-Hyacinthe, $321M of properties (houses, condos and plexes) changed hands in 2025, against $116M in 2016 (+176%). Each category's share in 2025: houses 60% ($194M, 372 sales); condos 18% ($56M, 192 sales); plexes 22% ($71M, 93 sales). In 2016, the plex weighed 25% of the dollars; in 2025, 22%: it lost 3 points. The category that grew the most in dollars since 2016 is the house (+187%). It is in line with the 23 cities tracked (median 18% in plexes). Source: Centris (Matrix), compiled October 11, 2026.
The short answer
In Saint-Hyacinthe, $321M of properties (houses, condos and plexes) changed hands in 2025, against $116M in 2016 (+176%). Each category's share in 2025: houses 60% ($194M, 372 sales); condos 18% ($56M, 192 sales); plexes 22% ($71M, 93 sales). In 2016, the plex weighed 25% of the dollars; in 2025, 22%: it lost 3 points. The category that grew the most in dollars since 2016 is the house (+187%). It is in line with the 23 cities tracked (median 18% in plexes).
Dollars by category, year by year
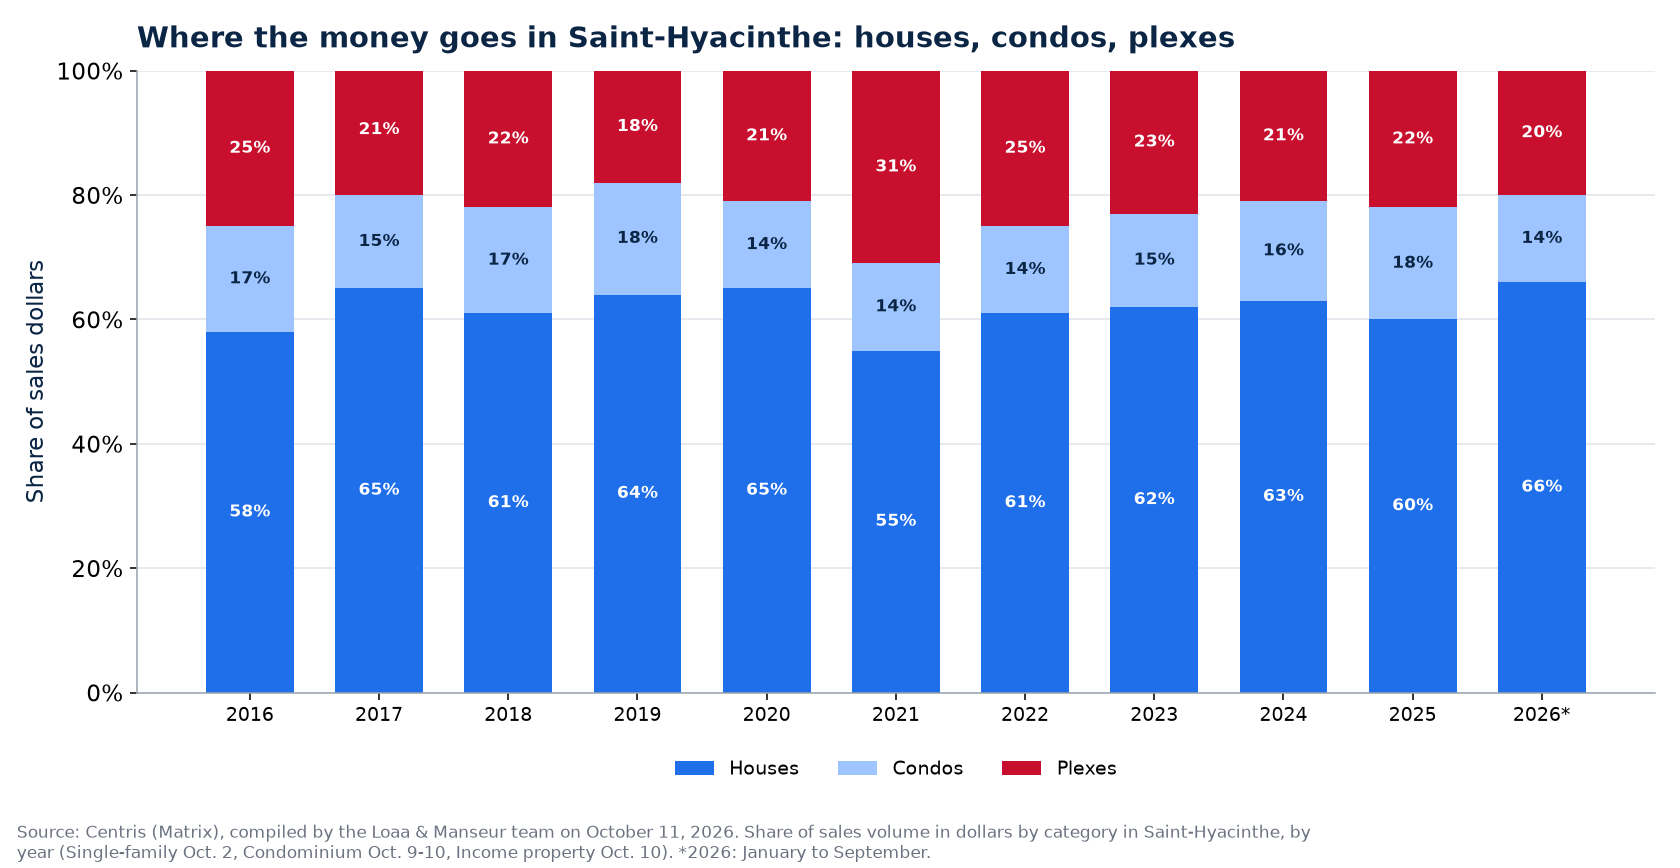
| Year | Total | Houses (share) | Condos (share) | Plexes (share) |
|---|---|---|---|---|
| 2016 | $116M | $67M (58%) | $20M (17%) | $29M (25%) |
| 2017 | $121M | $78M (65%) | $18M (15%) | $25M (21%) |
| 2018 | $143M | $87M (61%) | $25M (17%) | $31M (22%) |
| 2019 | $159M | $102M (64%) | $28M (18%) | $29M (18%) |
| 2020 | $184M | $119M (65%) | $25M (14%) | $40M (21%) |
| 2021 | $249M | $138M (55%) | $34M (14%) | $78M (31%) |
| 2022 | $246M | $150M (61%) | $34M (14%) | $61M (25%) |
| 2023 | $211M | $131M (62%) | $31M (15%) | $49M (23%) |
| 2024 | $261M | $163M (63%) | $42M (16%) | $56M (21%) |
| 2025 | $321M | $194M (60%) | $56M (18%) | $71M (22%) |
| 2026 (Jan. to Sept.) | $241M | $159M (66%) | $34M (14%) | $48M (20%) |
Sales volume in dollars by category and share of the total, Centris (Matrix), Single-family, Condominium and Income property categories. 2026: January to September.
Sales, average price and volume by category
| Category | Sales 2025 | Average price 2025 | Volume 2016 | Volume 2025 | 2016-2025 |
|---|---|---|---|---|---|
| Houses | 372 | $521,354 | $67M | $194M | +187% |
| Condos | 192 | $294,134 | $20M | $56M | +181% |
| Plexes | 93 | $758,074 | $29M | $71M | +147% |
What ten years of dollars say in Saint-Hyacinthe
- The plex weighed the most in 2021 (31% of the dollars) and the least in 2019 (18%); in 2026 (Jan. to Sept.), 20%. When its share rises, investors are buying; when it falls, families are buying houses.
- The average ticket: a plex sold for $758,074 on average in 2025 against $521,354 for a house, 1.45 times the house; the condo, $294,134. That is why 93 plex sales weigh 22% of the dollars.
- Ten years in dollars: houses +187%, condos +181%, plexes +147%; total +176%. The total's peak is 2025 ($321M); 2026 is running at $322M a year over nine months (+0% versus 2025).
- Plex versus condo: 22% against 18% of the dollars in 2025 (25% against 17% in 2016). The plex wins: the city is a market of rental buildings as much as of condominiums.
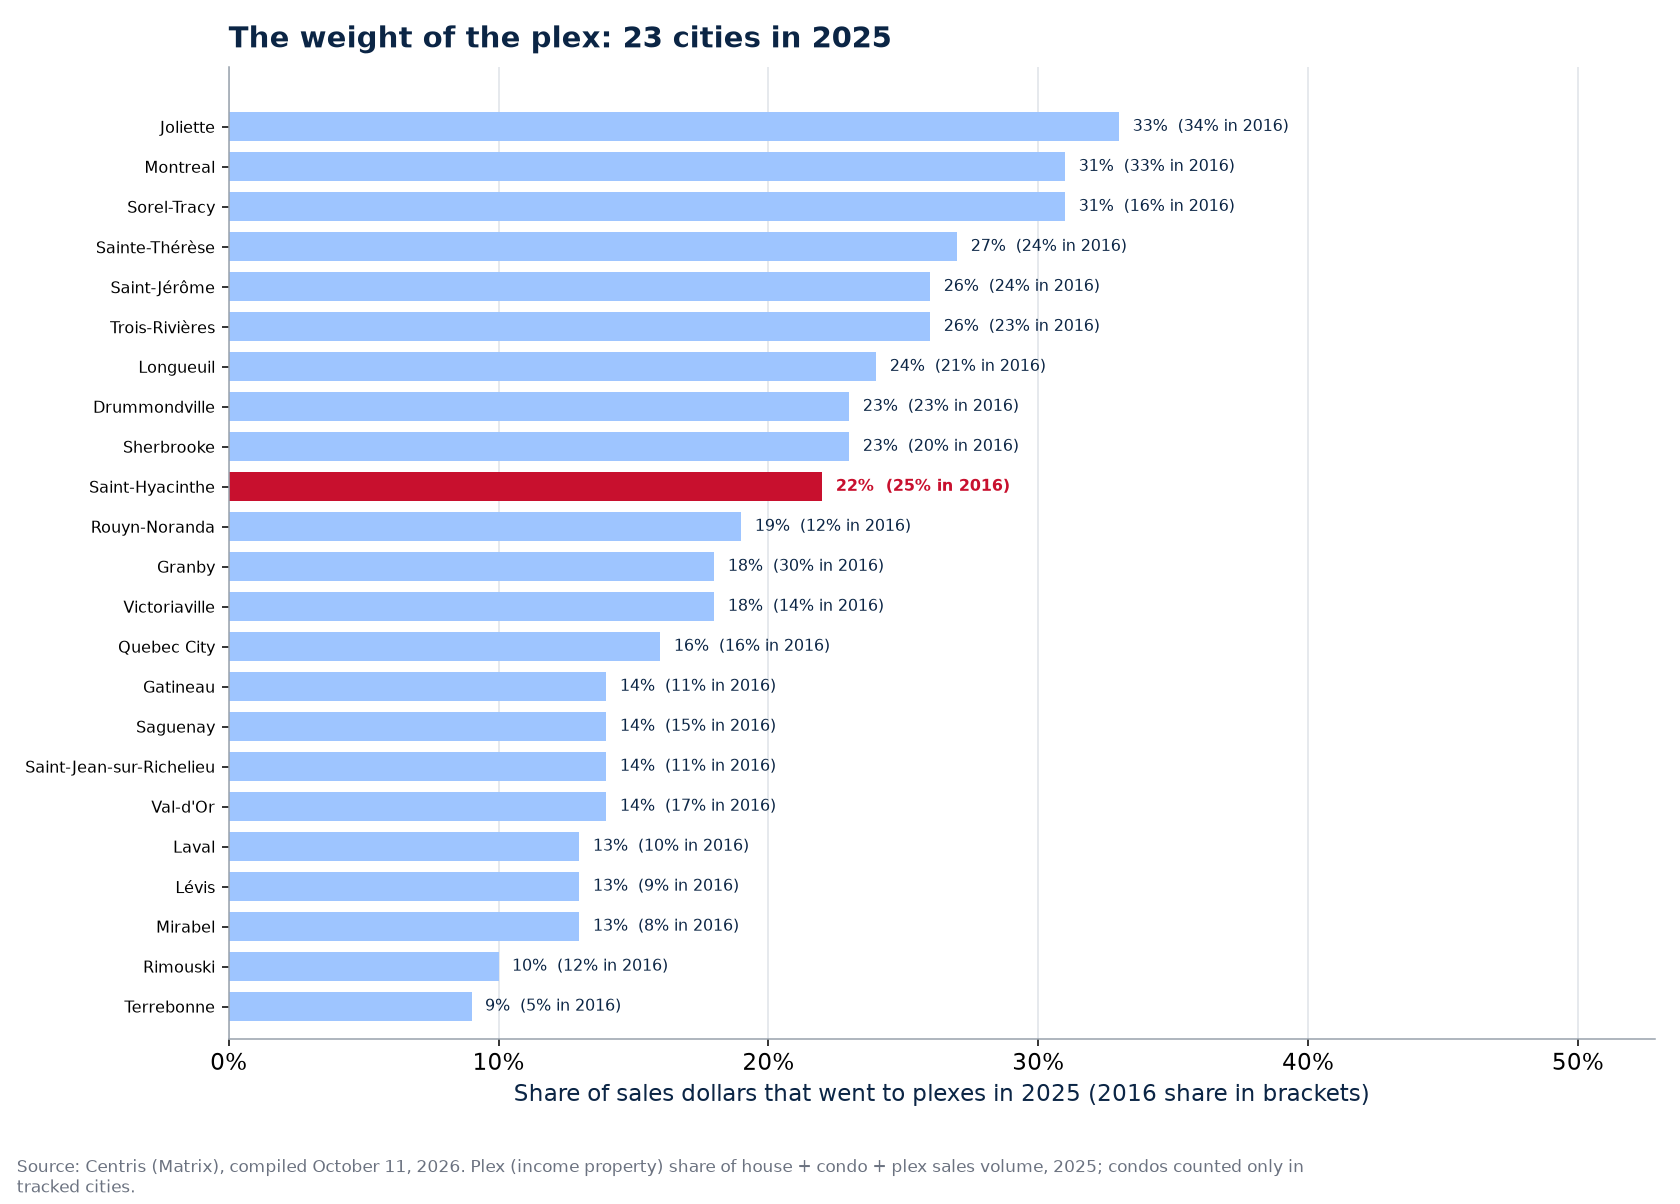
- Across the 23 cities tracked, the money splits in 2025: houses 49%, condos 28%, plexes 22% (in 2016: 52 / 25 / 23%). The plex share rose in 14 cities; the category that grew the most is the condo in 12 cities, the plex in 7 and the house in 4; the plex weighs more than the condo in 10 of the 18 cities where both are tracked; the total's peak is 2025 in 20 cities and 2021 in 3.
What it changes for selling or buying in Saint-Hyacinthe
In Saint-Hyacinthe, the money splits as in most of the cities tracked: houses 60%, condos 18%, plexes 22%. What the table tells a seller is which market they are selling in: the house compares with houses, the plex compares with rents; to a buyer, it says where the competition goes, the category whose share rises is where buyers crowd, the one whose share falls is where you negotiate. The detail by category is in house sales volume in Saint-Hyacinthe, condo sales volume in Saint-Hyacinthe and plex sales volume in Saint-Hyacinthe.
How to read these figures
Three Centris (Matrix) queries per city, already published separately: sales volume in dollars and number of sales by year for the Single-family category (October 2, 2026 query), Condominium (October 9 and 10) and Income property (October 10), whole municipality of Saint-Hyacinthe. The total adds the categories tracked; shares compare each category with that total. 2026 counts January to September.
Frequently asked questions
How many dollars of properties sell in Saint-Hyacinthe a year?
$321M in 2025 in Saint-Hyacinthe: houses $194M, condos $56M, plexes $71M. From January to September 2026, $241M.
What share goes to plexes in Saint-Hyacinthe?
22% of the dollars in 2025, against 25% in 2016 and 31% in 2021. Across the 23 cities tracked, the median is 18%.
Which category grew the most in Saint-Hyacinthe?
The house: +187% between 2016 and 2025, against +147% for the plex. Across the 23 cities tracked, the condo is the category that grew the most in 12 cities, the plex in 7, the house in 4.
Sources: Centris (Matrix), Statistics module, October 2, 2026 (Single-family), October 9 and 10, 2026 (Condominium) and October 10, 2026 (Income property) queries for the municipality of Saint-Hyacinthe, sales volume in dollars and number of sales by year; compiled by the Loaa & Manseur team, aggregates only, current year partial. The where the money goes in 23 cities hub compares the 23 cities.
Our proof, not our promises
The Loaa & Manseur team, led by Lotfi Manseur and Loaa Al Daow, is the number 1 team at RE/MAX Platine in 2024 and 2025, 6th RE/MAX team in Quebec, 15th in Canada and in the global top 50 of large residential teams according to the official RE/MAX ranking, computed on actual transactions. Its Google profile counts more than 220 reviews with a 4.9 rating. Its offices are at 55 avenue de l'Équinoxe in Brossard, one bridge from the island, and every broker's licence can be checked in the OACIQ public register. Three things to verify yourself before calling us, and to demand of any other broker.
Also available in French: version française de ce guide.
Published September 7, 2026 by the Loaa & Manseur team, the number 1 team at RE/MAX Platine in 2024 and 2025, 6th RE/MAX team in Quebec, 15th in Canada and in the global top 50 according to the official RE/MAX ranking. Tell us about your project.