Best month to sell · Granby · Centris 2016-2025
The number of houses sold in Granby in each month of the year, and the price obtained against the trend, over ten years of Centris sales: the peak, the trough, spring versus winter, the best-paying month, and when to list to sell at the right time. Centris figures, not estimates.
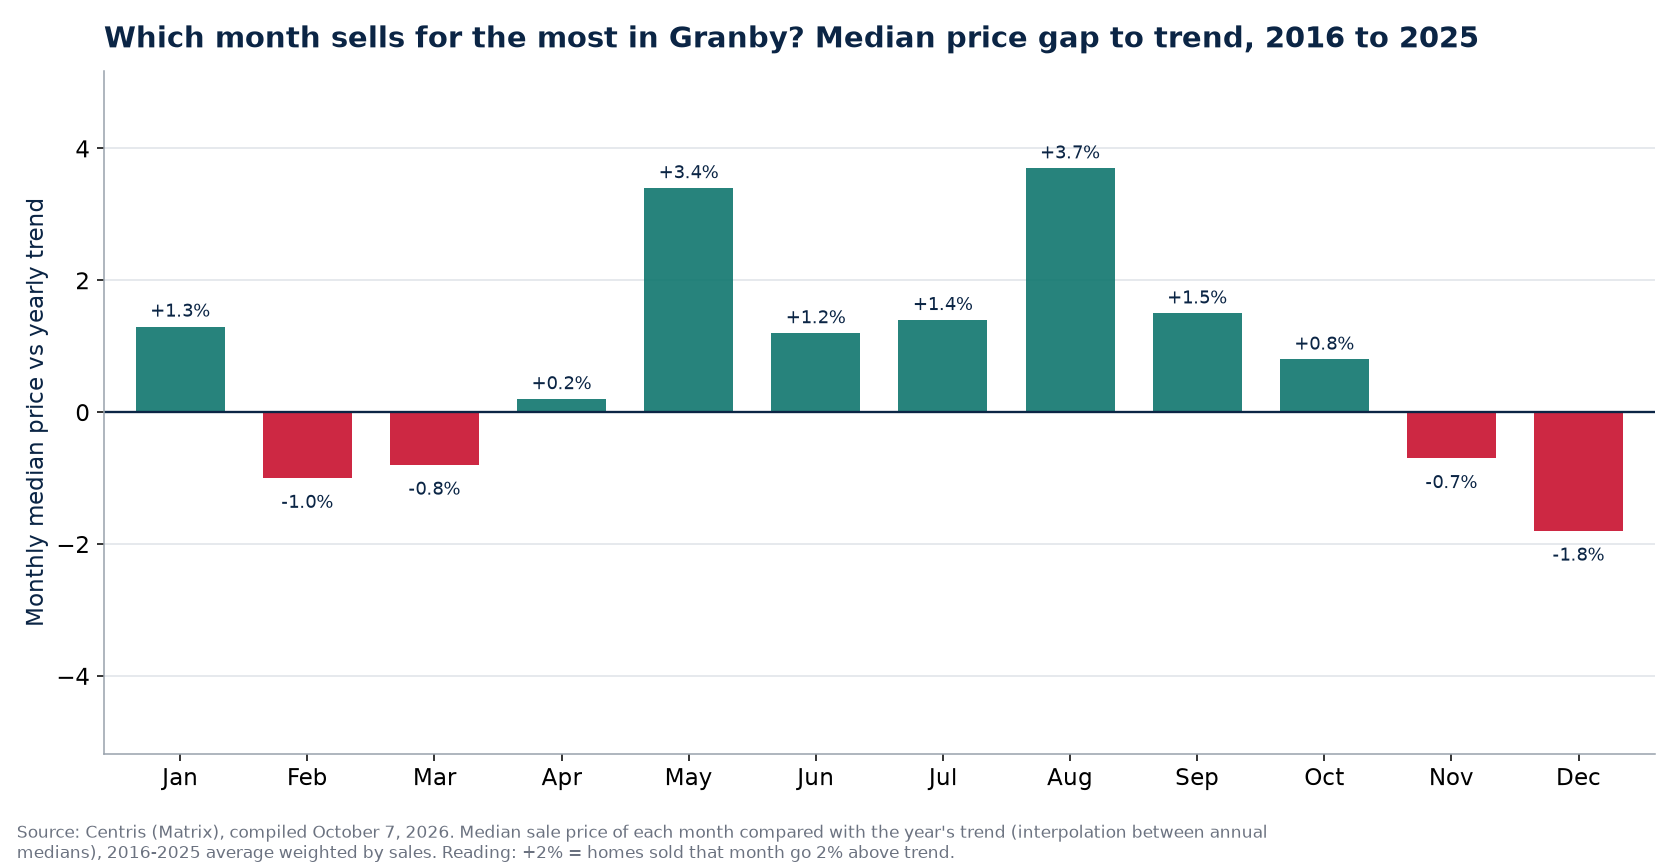
In Granby, the month with the most home sales is March: 11.5% of the 5,225 sales from 2016 to 2025, or 60 sales a year on average that month, against 31 in December, the quietest month (6.0%). Between peak and trough, the market turns 1.9 times faster, a milder seasonality than in most of the 50 cities tracked (median 2.1). On the price side, homes sold in August go 3.7% above the year's trend, those sold in December 1.8% below: a gap of 5.5 points between the best and the worst month. The best compromise between the number of buyers and the price obtained is May, which means listing from April. Source: Centris (Matrix), compiled October 7, 2026.
The short answer
In Granby, the month with the most home sales is March: 11.5% of the 5,225 sales from 2016 to 2025, or 60 sales a year on average that month, against 31 in December, the quietest month (6.0%). Between peak and trough, the market turns 1.9 times faster, a milder seasonality than in most of the 50 cities tracked (median 2.1). On the price side, homes sold in August go 3.7% above the year's trend, those sold in December 1.8% below: a gap of 5.5 points between the best and the worst month. The best compromise between the number of buyers and the price obtained is May, which means listing from April.
Sales and prices by month in Granby, ten years
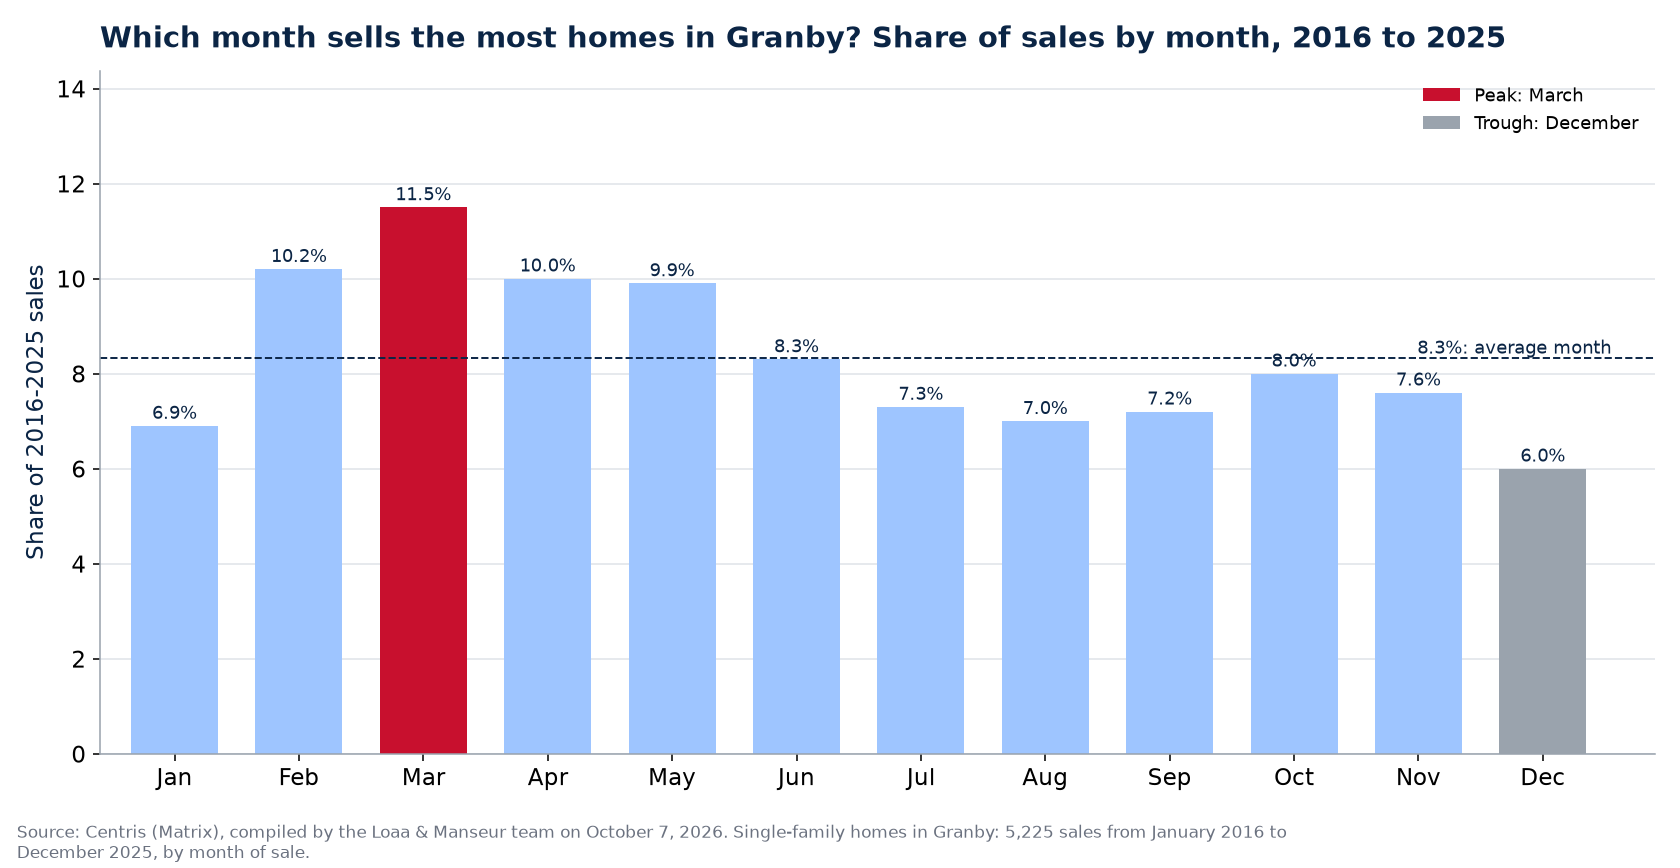
| Month | Sales per year (avg. 2016-2025) | Share of sales | Month price vs trend | Season |
|---|---|---|---|---|
| January | 36 | 6.9% | +1.3% | winter |
| February | 53 | 10.2% | -1.0% | winter |
| March (peak) | 60 | 11.5% | -0.8% | spring |
| April | 52 | 10.0% | +0.2% | spring |
| May | 52 | 9.9% | +3.4% | spring |
| June | 44 | 8.3% | +1.2% | summer |
| July | 38 | 7.3% | +1.4% | summer |
| August | 37 | 7.0% | +3.7% | summer |
| September | 38 | 7.2% | +1.5% | fall |
| October | 42 | 8.0% | +0.8% | fall |
| November | 40 | 7.6% | -0.7% | fall |
| December (trough) | 31 | 6.0% | -1.8% | winter |
Single-family category, whole municipality of Granby, Centris (Matrix), January 2016 to December 2025. Price vs trend: median price of the month compared with the year's trend, average weighted by sales.
What ten years of seasons say in Granby
- By season in Granby: 31% of sales in spring (March to May), 23% in summer, 23% in fall and 23% in winter (December to February). Spring sells 1.4 times more than winter.
- The strongest quarter is the first (29% of sales); the weakest, the third (22%).
- Prices by season (gap to the year's trend, weighted by sales): spring +0.8%, summer +2.0%, fall +0.5%, winter -0.5%. The seasonal price gap stays small: the month matters less than the asking price and the condition of the house.
- April 2020: only 23 sales in Granby, the lockdown month; buyers caught up the following summer. It is the only year of the ten when spring was not the peak.
- 2026 versus 2025, January to September: 447 sales against 448 (+0%). The market is a little less active than last year.
- Across the 50 cities tracked, March is the peak month (11.2% of sales) and January the trough (5.9%); the peak falls in spring in 49 cities and the trough in winter in 45. The median price premium is highest in April (+2.2%) and lowest in December (-1.8%).
What it changes when selling or buying in Granby
To sell in Granby, aiming for the peak means listing before it: a house put on the market at the end of January or early February gets its showings during the weeks with the most buyers, and the accepted offer lands in March. The best-paying month is not necessarily the busiest: in August, homes go 3.7% above trend, while the sales peak is in March. For a buyer, December and the winter months offer less competition and sellers who have been waiting since the fall, but also less choice: you have to be ready to decide on what is there. And in every case, the seasonal price gap remains smaller than what a good asking price and a good marketing plan bring: selling at the wrong price in May costs more than selling at the right price in November.
How to read these figures
Two measures from the same Centris query, same settings: Single-family category, whole municipality of Granby, by month over ten years. Sales are added by calendar month over 2016-2025 (5,225 sales); 2026 is left out because the year is not over. Prices are monthly medians compared with the year's trend, then averaged giving more weight to the months with more sales. A month with 31 sales a year on average, like December, gives a fragile median: read the premiums as an order of magnitude. Time to sell, month by month, is in days on market in Granby.
Frequently asked questions
Which month sells the most homes in Granby?
March: 11.5% of the past ten years' sales, 60 a year on average. Spring (March to May) concentrates 31% of sales.
Which month sells for the most in Granby?
August, with a median price 3.7% above the year's trend; December is the lowest (-1.8%). The gap remains modest: it does not justify waiting six months to sell.
What is the quietest month in Granby?
December: 31 sales a year on average, 6.0% of the total. Fewer buyers, but also fewer homes for sale, so a serious seller in January faces less competition than the same house in May.
Source: Centris (Matrix), Statistics module, query of October 7, 2026 for the municipality of Granby: Single-family category, sales and median sale price by month over ten years; yearly trend from the medians of the September 16, 2026 query; compiled by the Loaa & Manseur team, aggregates only. The best month to sell in 50 cities hub compares the 50 cities.
Our other data series in Granby, from the same Centris listings:
- Buyer's or seller's market in Granby
- How much buyers negotiate in Granby
- Houses that do not sell in Granby
- Home prices in Granby, ten years
Each series is recalculated from actual sales, aggregates only.
Our proof, not our promises
The Loaa & Manseur team, led by Lotfi Manseur and Loaa Al Daow, is the number 1 team at RE/MAX Platine in 2024 and 2025, 6th RE/MAX team in Quebec, 15th in Canada and in the global top 50 of large residential teams according to the official RE/MAX ranking, computed on actual transactions. Its Google profile counts more than 220 reviews with a 4.9 rating. Its offices are at 55 avenue de l'Équinoxe in Brossard, one bridge from the island, and every broker's licence can be checked in the OACIQ public register. Three things to verify yourself before calling us, and to demand of any other broker.
Also available in French: version française de ce guide.
Published September 7, 2026 by the Loaa & Manseur team, the number 1 team at RE/MAX Platine in 2024 and 2025, 6th RE/MAX team in Quebec, 15th in Canada and in the global top 50 according to the official RE/MAX ranking. Tell us about your project.