Buyer's or seller's · Rimouski · Centris 2026
How many homes are for sale in Rimouski, how many arrive, how many leave, and what that means in months of inventory. Twelve months of Centris figures, not an impression.
In Rimouski, it is a seller's market, and one of the tightest of the 50 cities tracked: 2.1 months of inventory (12-month median), rank 5 of 50. In Aug. 2026, the last complete month, 80 single-family homes were for sale against 26 sales in the month, or 3.1 months of inventory. A house sells there in 7 days (12-month median), at 100% of asking price. Source: Centris (Matrix), compiled September 17, 2026.
The short answer
In Rimouski, it is a seller's market, and one of the tightest of the 50 cities tracked: 2.1 months of inventory (12-month median), rank 5 of 50. In Aug. 2026, the last complete month, 80 single-family homes were for sale against 26 sales in the month, or 3.1 months of inventory. A house sells there in 7 days (12-month median), at 100% of asking price.
Listings, sales and months of inventory, month by month
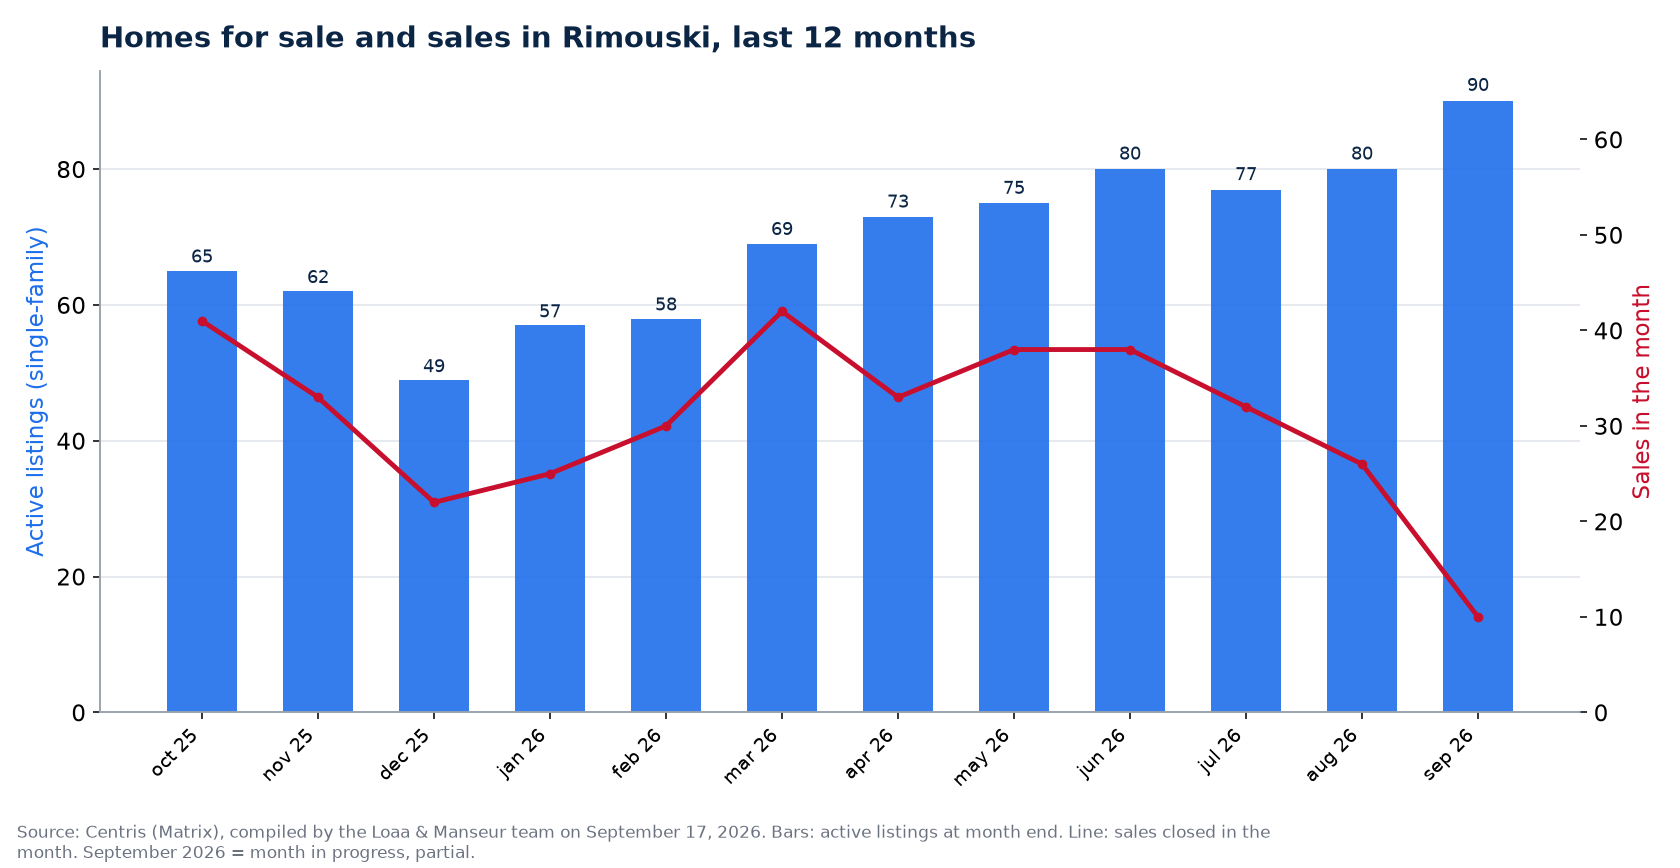
| Month | Active listings | New listings | Sales | Months of inventory | Median days to sell | Sold / asking |
|---|---|---|---|---|---|---|
| Oct. 2025 | 65 | 40 | 41 | 1.6 | 6 | 99% |
| Nov. 2025 | 62 | 35 | 33 | 1.9 | 7 | 100% |
| Dec. 2025 | 49 | 11 | 22 | 2.2 | 12 | 99% |
| Jan. 2026 | 57 | 37 | 25 | 2.3 | 8 | 100% |
| Feb. 2026 | 58 | 36 | 30 | 1.9 | 6 | 101% |
| Mar. 2026 | 69 | 57 | 42 | 1.6 | 7 | 101% |
| Apr. 2026 | 73 | 40 | 33 | 2.2 | 8 | 100% |
| May 2026 | 75 | 40 | 38 | 2.0 | 6 | 100% |
| Jun. 2026 | 80 | 48 | 38 | 2.1 | 6 | 99% |
| Jul. 2026 | 77 | 34 | 32 | 2.4 | 11 | 100% |
| Aug. 2026 | 80 | 31 | 26 | 3.1 | 18 | 98% |
| Sep. 2026 (in progress) | 90 | 28 | 10 | provisional | 6 | 100% |
Inventory computed by Matrix from about 480 listings; days to sell from about 370 listings; monthly sales from the same database. September 2026 is the month in progress: its sales are partial and its months of inventory are not computed.
What the 12 months say in Rimouski

- All 11 complete months are under 4 months of inventory: not a single balanced month in Rimouski since Oct. 2025.
- The tightest month was Oct. 2025 (1.6 months of inventory), the loosest Aug. 2026 (3.1 months).
- Active listings: 65 in Oct. 2025, 80 in Aug. 2026 (+23%), a median of 69 homes for sale at any time.
- 360 sales for 409 new listings in 12 months: 88% of what comes to market sells. Above 72%, new supply does not rebuild inventory.
- Mar. 2026 was both the month with the most new listings (57) and the most sales (42).
- Sold-to-asking ratio at 100% or more in 7 of 11 months: bidding above asking is the norm, not the exception.
For a seller in Rimouski
With 2.1 months of inventory, a seller in Rimouski has few competitors: a median of 69 active homes for 33 sales a month. The asking price must stay accurate, because it is what triggers multiple showings; a median of 7 days to sell means a home past 14 days is already sending a signal.
For a buyer in Rimouski
For a buyer, 69 homes for sale at any time is not much: get pre-approved, visit within 48 hours and write a clean offer. Our page on negotiating in Rimouski shows how much buyers actually get.
How to read these numbers
A home counts as an active listing until an offer is accepted. The ratio between that stock and the month's sales is the months of inventory. The usual Quebec scale: seller's market under 4 months, balanced from 4 to 6, buyer's market above; the QPAREB, at the scale of large regions, puts balance between 8 and 10 months, which is why it may call "balanced" a market a Rimouski seller experiences as tight. Categories are Centris's own ("Single-family"); September 2026 is in progress and excluded from the medians.
Frequently asked questions
Is it a buyer's or a seller's market in Rimouski in 2026?
A seller's market: 2.1 months of inventory (12-month median), 3.1 months in Aug. 2026.
How many homes are for sale in Rimouski?
80 active single-family listings on Centris at the end of Aug. 2026, against 65 in Oct. 2025; 409 new listings in 12 months.
What is the best month to sell in Rimouski?
The month with the most home sales in Rimouski was Mar. 2026 (42 sales), and the tightest month for buyers, hence the best for sellers, was Oct. 2025 (1.6 months of inventory).
Source: Centris (Matrix), Statistics module, queries run on September 16 and 17, 2026 for the municipality 'Rimouski': active and new listings by month, sales by month, median days to sell and sold-to-asking ratio; compiled by the Loaa & Manseur team, aggregates only, current month provisional. The buyer's or seller's market by city hub compares all 50 cities; home prices in Rimouski give ten years of perspective.
And by type of house in Rimouski:
Single-storey versus two-storey, ten years of median prices from the same Centris listings.
And by number of bedrooms in Rimouski:
Houses with 3, 4 and 5 or more bedrooms, ten years of median prices from the same Centris listings.
And how long it takes to sell in Rimouski:
Median days on market for houses and condos, ten years from the same Centris listings.
And the number of sales in Rimouski:
Houses, condos and plexes sold per year, ten years from the same Centris listings.
And plex prices in Rimouski:
Median plex price per year, next to houses and condos, ten years from the same Centris listings.
And the number of homes for sale in Rimouski:
Inventory and new listings per year, ten years from the same Centris listings.
And sale price relative to asking in Rimouski:
Bidding wars or negotiation, year by year, ten years from the same Centris listings.
And the houses that do not sell in Rimouski:
Expired listings and failure rate, year by year, ten years from the same Centris listings.
And the average house price in Rimouski:
Mean, median and asking price, year by year, ten years from the same Centris listings.
And the sales volume in Rimouski:
How many dollars change hands each year, and whether price or the number of sales rose, ten years from the same Centris listings.
And house appreciation in Rimouski:
What a house bought in each year since 2016 is worth today, ten years from the same Centris listings.
And the jump from condo to house in Rimouski:
- From condo to house in Rimouski: a $111,000 gap in 2026, and how much of it your condo's gain covers
The gap between house and condo year by year, and how much of it the condo's gain covers, ten years from the same Centris listings.
All the statistics in Rimouski at a glance:
Twelve 2026 Centris indicators, the city's rank on each, and a link to ten years of detail.
And the down payment to buy in Rimouski:
The minimum, the 20%, the CMHC premium and what the FHSA covers, computed on the 2026 median price.
And the number of condos for sale in Rimouski:
Condominium inventory and new listings per year, ten years from the same Centris listings, condo versus house.
And the best month to sell in Rimouski:
Sales and prices by month over ten years, from the same Centris listings.
And the condos that do not sell in Rimouski:
Expired condo listings and failure rate, year by year, ten years from the same Centris listings.
And the plexes for sale in Rimouski:
Plex inventory and new listings, year by year, ten years from the same Centris listings.
And the best month to sell a condo in Rimouski:
Condo sales and prices by month over ten years, from the same Centris listings.
And the plexes that do not sell in Rimouski:
Expired plex listings and failure rate, year by year, ten years from the same Centris listings.
And condo sale versus asking price in Rimouski:
Condo sold ÷ asking ratio, year by year, ten years from the same Centris listings.
And plex sale versus asking price in Rimouski:
Plex sold ÷ asking ratio, year by year, ten years from the same Centris listings.
And the mortgage payment on the median house in Rimouski:
The year's Centris price × the year's 5-year rate charged, 20% down, 25 years, ten years year by year.
And house prices in Rimouski adjusted for inflation:
The year's Centris price in 2026 dollars (Quebec CPI), posted versus real increase, ten years year by year.
And the mortgage payment on the median condo in Rimouski:
The year's Centris price × the year's 5-year rate charged, 20% down, 25 years, ten years year by year.
And plex days on market in Rimouski:
Median and average days on market of plexes, year by year, ten years from the same Centris listings.
And duplex, triplex and quadruplex prices in Rimouski:
Median price by type and per unit, year by year, ten years from the same Centris listings.
And semi-detached and row house prices in Rimouski:
Median price by house type, year by year, ten years from the same Centris listings.
And houses under $500,000 in Rimouski:
Sales under the threshold and share of sales, year by year, ten years from the same Centris listings.
And sales by price range in Rimouski:
Distribution of sales by bracket in 2020, 2023 and 2026, from the same Centris listings.
And days on market by price in Rimouski:
Median days by price bracket over twelve months, from the same Centris listings.
And prices by lot size in Rimouski:
Small lot versus large lot, year by year, ten years from the same Centris listings.
And condo sales volume in Rimouski:
Dollars sold, sales and average price, year by year, ten years from the same Centris listings.
And the average condo price in Rimouski:
Average, median and asking price, year by year, ten years from the same Centris listings.
And condo days on market by price in Rimouski:
Median condo days by price bracket over twelve months, from the same Centris listings.
And plex days on market by price in Rimouski:
Median plex days by price bracket over twelve months, from the same Centris listings.
And plex sales by price range in Rimouski:
Distribution of plex sales by bracket in 2020 and 2026, from the same Centris listings.
And the average plex price in Rimouski:
Average, median and asking price, year by year, ten years from the same Centris listings.
And plex sales volume in Rimouski:
Dollars sold, sales and average price, year by year, ten years from the same Centris listings.
And where the money goes in Rimouski, house, condo or plex:
Share of sales dollars by category over ten years, from the same Centris listings.
And what sells at what price in Rimouski, house, condo or plex:
2026 sales by price range and category, from the same Centris listings.
And which sells fastest in Rimouski at the same price:
Days on market by range and category over twelve months, from the same Centris listings.
And condo sales by price range in Rimouski:
Distribution of condo sales by bracket in 2020 and 2026, from the same Centris listings.
The market in Rimouski this month:
Days on market, sold against asking, inventory and September 2026 verdict in Rimouski, over the past twelve Centris months.
The condo market in Rimouski this month:
Days on market, sold against asking, median price and September 2026 verdict for the condo in Rimouski, compared with the house, over the past twelve Centris months.
And what the welcome tax costs on that house in Rimouski:
Welcome tax on each year's median house, city's 2026 grid, first-time buyer credit.
And the salary it takes to buy that house in Rimouski, 2016 against 2026:
Gross income required for each year's median house, the year's contracted rate, labelled assumptions.
And houses that linger by price range in Rimouski:
Average and median days on market by price range over twelve months, from the same Centris listings.
And split-level and storey-and-a-half houses in Rimouski:
Split-level, storey-and-a-half, bungalow and two-storey, ten years of median prices from the same Centris listings.
And maison negotiation by price in Rimouski:
Sold-to-asking ratio by price bracket over twelve months, from the same Centris listings.
And condo negotiation by price in Rimouski:
Sold-to-asking ratio by price bracket over twelve months, from the same Centris listings.
And plex negotiation by price in Rimouski:
Sold-to-asking ratio by price bracket over twelve months, from the same Centris listings.
And where the money goes by price bracket in Rimouski:
Share of dollars and share of sales by price range over twelve months, from the same Centris listings.
And price cuts before the sale by price range in Rimouski:
Sold-to-original and sold-to-asking ratios by price range over twelve months, from the same Centris listings.
And by number of bathrooms in Rimouski:
Houses with 1, 2 and 3 or more bathrooms, ten years of median prices from the same Centris listings.
Is the market going down in Rimouski? The quarter-by-quarter answer:
Median price, number of sales and days on market for houses and condos, Centris numbers.
Our proof, not our promises
The Loaa & Manseur team, led by Lotfi Manseur and Loaa Al Daow, is the number 1 team at RE/MAX Platine in 2024 and 2025, 6th RE/MAX team in Quebec, 15th in Canada and in the global top 50 of large residential teams according to the official RE/MAX ranking, computed on actual transactions. Its Google profile counts more than 220 reviews with a 4.9 rating. Its offices are at 55 avenue de l'Équinoxe in Brossard, one bridge from the island, and every broker's licence can be checked in the OACIQ public register. Three things to verify yourself before calling us, and to demand of any other broker.
Also available in French: version française de ce guide.
Published September 7, 2026 by the Loaa & Manseur team, the number 1 team at RE/MAX Platine in 2024 and 2025, 6th RE/MAX team in Quebec, 15th in Canada and in the global top 50 according to the official RE/MAX ranking. Tell us about your project.