Homes for sale · Sorel-Tracy · Centris 2016-2026
The number of houses for sale in Sorel-Tracy at each month-end, and the number of new listings, year by year since 2016: the peak, the frenzy trough, the absorption rate, months of inventory, and why prices doubled without sales growing. Centris figures, not estimates.
In Sorel-Tracy, an average of 144 houses were for sale on Centris at each month-end in 2026 (January to August), against 294 in 2016: inventory is 49% of what it was ten years ago, in line with the 50 cities tracked (median 46%). The trough was 2021 (54 houses, -82% from the 2016 peak); since then, inventory has climbed back 167%. New listings went from 494 in 2016 to 513 in 2025 (+4%): as many or more homes are being listed than before, but they go far faster. The result: 4.9 months of inventory in 2026 against 13.6 in 2016. Source: Centris (Matrix), compiled September 30, 2026.
The short answer
In Sorel-Tracy, an average of 144 houses were for sale on Centris at each month-end in 2026 (January to August), against 294 in 2016: inventory is 49% of what it was ten years ago, in line with the 50 cities tracked (median 46%). The trough was 2021 (54 houses, -82% from the 2016 peak); since then, inventory has climbed back 167%. New listings went from 494 in 2016 to 513 in 2025 (+4%): as many or more homes are being listed than before, but they go far faster. The result: 4.9 months of inventory in 2026 against 13.6 in 2016.
New listings, sales and homes for sale per year

| Year | New listings | Sales | Absorption | Active, monthly average | Active, year-end | Months of inventory |
|---|---|---|---|---|---|---|
| 2016 | 494 | 259 | 52% | 294 | 273 | 13.6 |
| 2017 | 507 | 298 | 59% | 274 | 246 | 11.0 |
| 2018 | 481 | 291 | 60% | 263 | 238 | 10.8 |
| 2019 | 486 | 348 | 72% | 231 | 189 | 8.0 |
| 2020 | 373 | 414 | 111% | 117 | 53 | 3.4 |
| 2021 | 410 | 396 | 97% | 54 | 32 | 1.6 |
| 2022 | 418 | 329 | 79% | 63 | 74 | 2.3 |
| 2023 | 410 | 307 | 75% | 85 | 83 | 3.3 |
| 2024 | 505 | 361 | 71% | 110 | 108 | 3.7 |
| 2025 | 513 | 395 | 77% | 105 | 105 | 3.2 |
| 2026 (Jan. to Aug.) | 428 | 249 | 58% | 144 | 143 | 4.9 |
Single-family category, whole municipality of Sorel-Tracy, Centris (Matrix). Absorption: sales ÷ new listings of the same year. Months of inventory: active ÷ monthly sales. 2026: eight months.
What ten years of inventory say in Sorel-Tracy
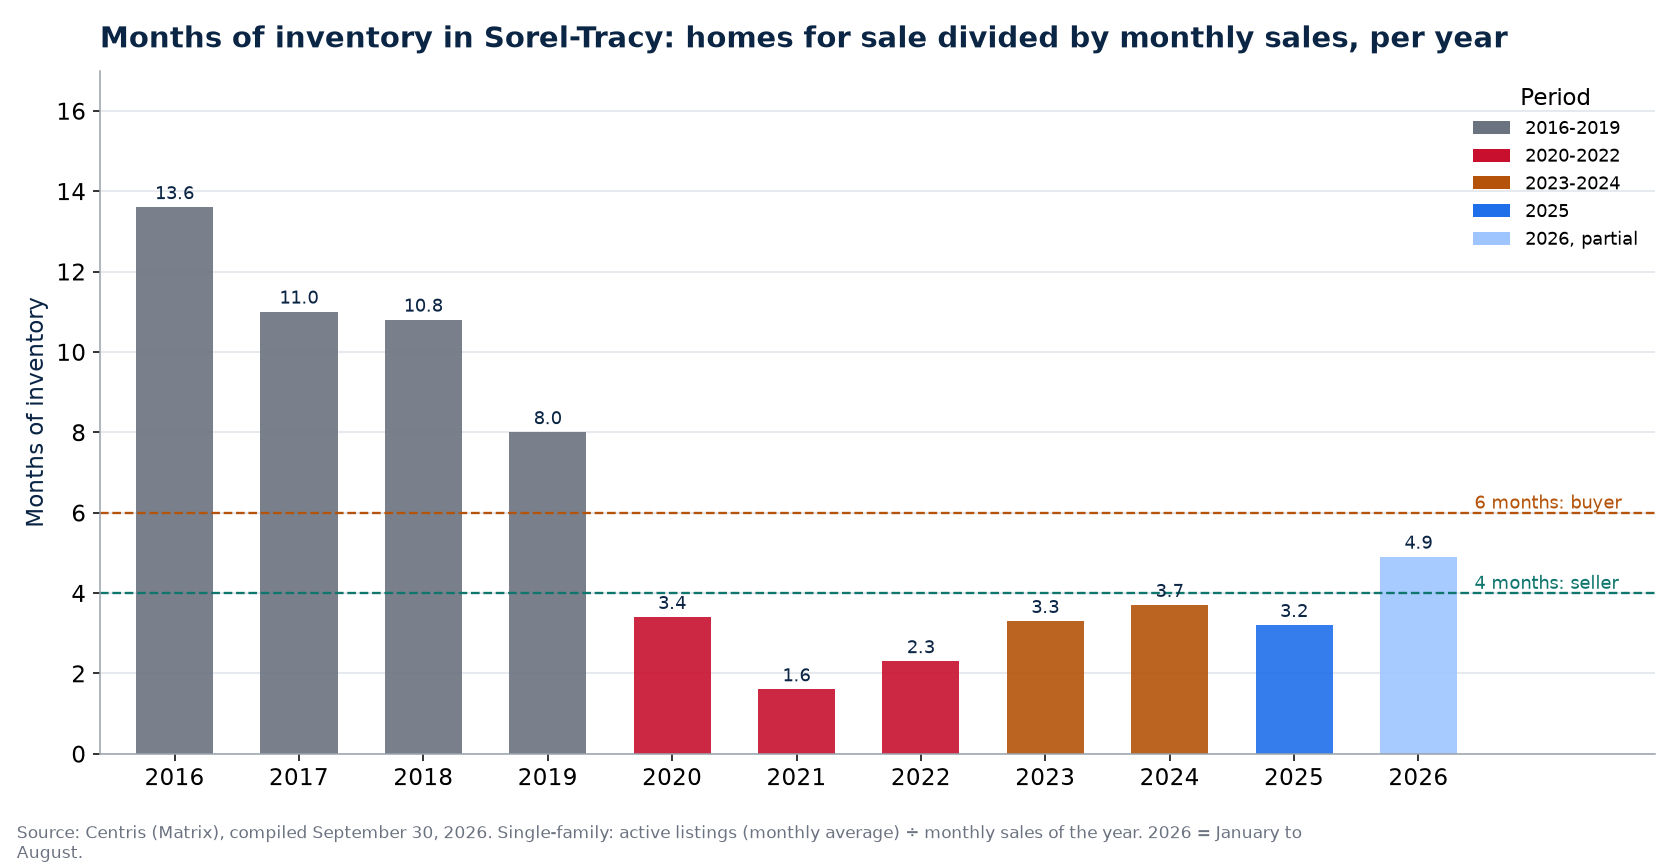
- Four markets in ten years in Sorel-Tracy: 268 homes for sale on average in 2016-2019, 63 during the 2020-2022 frenzy, 98 when high rates returned, 105 in 2025 and 144 in 2026.
- Inventory peak: 2016 (294); trough: 2021 (54). Between the two, the choice offered to a buyer was divided by 5.4.
- New listings: 513 in 2025 at the high, 373 in 2020 at the low. New listings held up (+4% since 2016): the inventory decline comes from the speed of sales, not a lack of sellers.
- Absorption rate (year's sales ÷ new listings): 52% in 2016, 97% in 2021, 77% in 2025. More than seven homes listed out of ten find a buyer within the year.
- Months of inventory (homes for sale ÷ monthly sales): 13.6 in 2016, 1.6 at the 2021 trough, 3.2 in 2025, 4.9 in 2026. Under 4 months, the seller leads; above 6, the buyer.
- 2026 (Jan. to Aug.) versus 2025: average inventory is up 37% (105 to 144), and new listings are running at 642 at an annual pace (+25%, a simple twelve-month projection). Choice is coming back a little, without returning to 2016. End of August 2026: 143 active houses.
- Across the 50 cities tracked, 2026 inventory is a median 46% of 2016, it is at half or less in 32 cities, and it is climbing versus 2025 in 43 cities.
What it changes when selling or buying in Sorel-Tracy
At 4.9 months of inventory, Sorel-Tracy leaves more room to the buyer than most of the cities tracked: they can visit several houses, compare, and sometimes negotiate. For a seller, the listing price matters more than elsewhere, because the buyer has alternatives. It is not a buyer's market in the 2016 sense (13.6 months), but an overpriced house stays listed. The rest of the table explains prices: with 51% fewer homes for sale than in 2016, the median price doubled without the number of sales growing, and it will not come down until inventory does come back.
How to read these figures
Two measures from the same Centris query, same settings: Single-family category, whole municipality, by month over ten years, then aggregated by year. Inventory is a month-end snapshot averaged over the year; new listings are a flow added over the year. A house withdrawn and relisted counts twice in the flow and once in the snapshot. 2026 stops in August: the annual pace of new listings is a rule of three, not a forecast. The sales in the middle column are those of number of sales in Sorel-Tracy.
Frequently asked questions
How many houses are for sale in Sorel-Tracy in 2026?
An average of 144 single-family houses active on Centris at each month-end in 2026 (January to August), 143 at the end of August. In 2016 it was 294.
Is inventory coming back in Sorel-Tracy?
Yes, a little: 144 in 2026 against 105 in 2025 (+37%), and 54 at the 2021 trough. But we remain at 49% of 2016 inventory.
Why are there fewer homes for sale in Sorel-Tracy than in 2016?
Speed: new listings moved +4% since 2016, but absorption went from 52% to 77%. What gets listed sells within the year.
Source: Centris (Matrix), Statistics module, queries of September 30, 2026 for the municipality of Sorel-Tracy: Single-family category, new listings and active listings by month over ten years, aggregated by year; sales per year from the September 16, 2026 query; compiled by the Loaa & Manseur team, aggregates only, current year partial. The homes for sale and inventory in 50 cities hub compares the 50 cities.
Our other data series in Sorel-Tracy, from the same Centris listings:
- Buyer's or seller's market in Sorel-Tracy
- How much buyers negotiate in Sorel-Tracy
- Houses that do not sell in Sorel-Tracy
- Home prices in Sorel-Tracy, ten years
Each series is recalculated from actual sales, aggregates only.
And sale price relative to asking in Sorel-Tracy:
Bidding wars or negotiation, year by year, ten years from the same Centris listings.
And the houses that do not sell in Sorel-Tracy:
Expired listings and failure rate, year by year, ten years from the same Centris listings.
And the average house price in Sorel-Tracy:
Mean, median and asking price, year by year, ten years from the same Centris listings.
And the sales volume in Sorel-Tracy:
How many dollars change hands each year, and whether price or the number of sales rose, ten years from the same Centris listings.
And house appreciation in Sorel-Tracy:
What a house bought in each year since 2016 is worth today, ten years from the same Centris listings.
All the statistics in Sorel-Tracy at a glance:
Twelve 2026 Centris indicators, the city's rank on each, and a link to ten years of detail.
Our proof, not our promises
The Loaa & Manseur team, led by Lotfi Manseur and Loaa Al Daow, is the number 1 team at RE/MAX Platine in 2024 and 2025, 6th RE/MAX team in Quebec, 15th in Canada and in the global top 50 of large residential teams according to the official RE/MAX ranking, computed on actual transactions. Its Google profile counts more than 220 reviews with a 4.9 rating. Its offices are at 55 avenue de l'Équinoxe in Brossard, one bridge from the island, and every broker's licence can be checked in the OACIQ public register. Three things to verify yourself before calling us, and to demand of any other broker.
Also available in French: version française de ce guide.
Published September 7, 2026 by the Loaa & Manseur team, the number 1 team at RE/MAX Platine in 2024 and 2025, 6th RE/MAX team in Quebec, 15th in Canada and in the global top 50 according to the official RE/MAX ranking. Tell us about your project.