Inflation-adjusted prices · Quebec City · 2016-2026
The median house price in Quebec City every year since 2016, as posted and converted to 2026 dollars with Quebec's consumer price index: what the house really gained above inflation, the years of real decline, the peak in purchasing power, and the condo alongside. Public figures, not estimates.
In Quebec City, the median house went from $250,000 in 2016 to $480,000 in 2026 (Jan. to Sept.), +92% in current dollars. But a 2016 dollar is worth $1.32 of 2026: Quebec's consumer price index rose 31.5% over the period. In 2026 dollars, the 2016 house was worth $328,822; the real increase, the one above inflation, is therefore +46%, one of the weakest among the 50 cities tracked (median +70%). Since the 2022 peak, it is another story: +42% in current dollars but +26% in constant dollars, still a real increase. Sources: Centris, Statistics Canada, compiled October 8, 2026.
The short answer
In Quebec City, the median house went from $250,000 in 2016 to $480,000 in 2026 (Jan. to Sept.), +92% in current dollars. But a 2016 dollar is worth $1.32 of 2026: Quebec's consumer price index rose 31.5% over the period. In 2026 dollars, the 2016 house was worth $328,822; the real increase, the one above inflation, is therefore +46%, one of the weakest among the 50 cities tracked (median +70%). Since the 2022 peak, it is another story: +42% in current dollars but +26% in constant dollars, still a real increase.
Posted price and price in 2026 dollars, by year
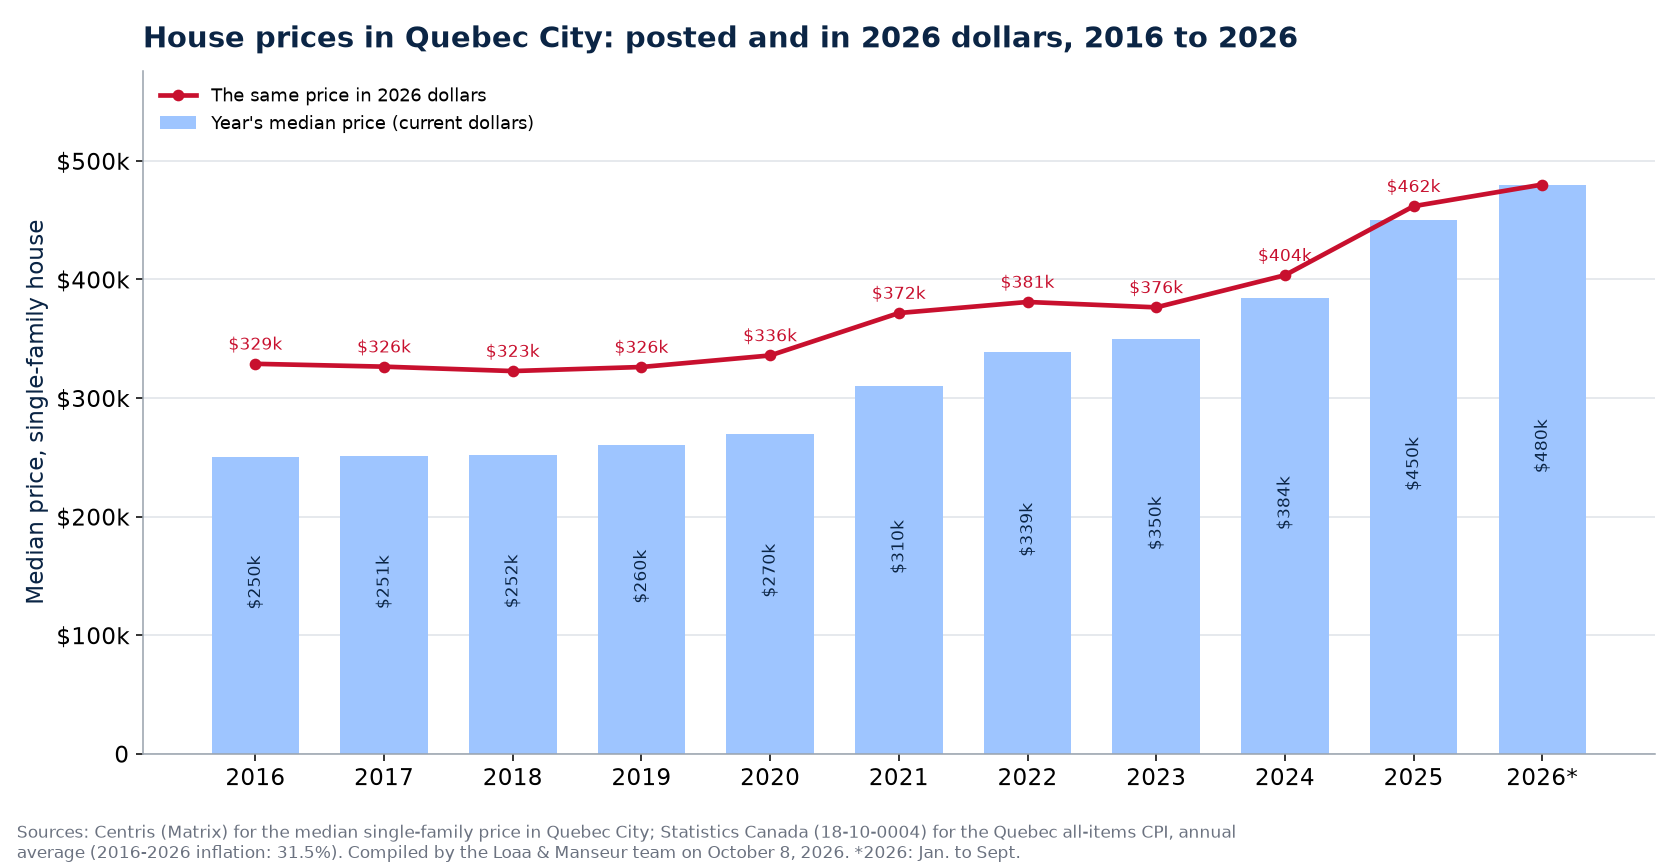
| Year | Median price (current dollars) | Quebec CPI | Price in 2026 dollars | Condo in 2026 dollars |
|---|---|---|---|---|
| 2016 | $250,000 | 125.6 | $328,822 | $255,823 |
| 2017 | $250,750 | 126.9 | $326,429 | $252,552 |
| 2018 | $252,000 | 129.0 | $322,716 | $248,760 |
| 2019 | $260,000 | 131.7 | $326,135 | $245,417 |
| 2020 | $270,000 | 132.8 | $335,873 | $242,575 |
| 2021 | $310,000 | 137.8 | $371,640 | $251,756 |
| 2022 | $339,000 | 147.0 | $380,971 | $264,095 |
| 2023 | $350,000 | 153.6 | $376,432 | $263,503 |
| 2024 | $384,000 | 157.2 | $403,542 | $288,942 |
| 2025 | $450,000 | 161.0 | $461,739 | $323,217 |
| 2026 (Jan. to Sept.) | $480,000 | 165.2 | $480,000 | $335,000 |
Median price of single-family houses sold in Quebec City, Centris (Matrix). Quebec all-items CPI, Statistics Canada, annual average (2026: January to August). 2026 dollars = price × 2026 CPI ÷ year's CPI.
What ten years in constant dollars say in Quebec City
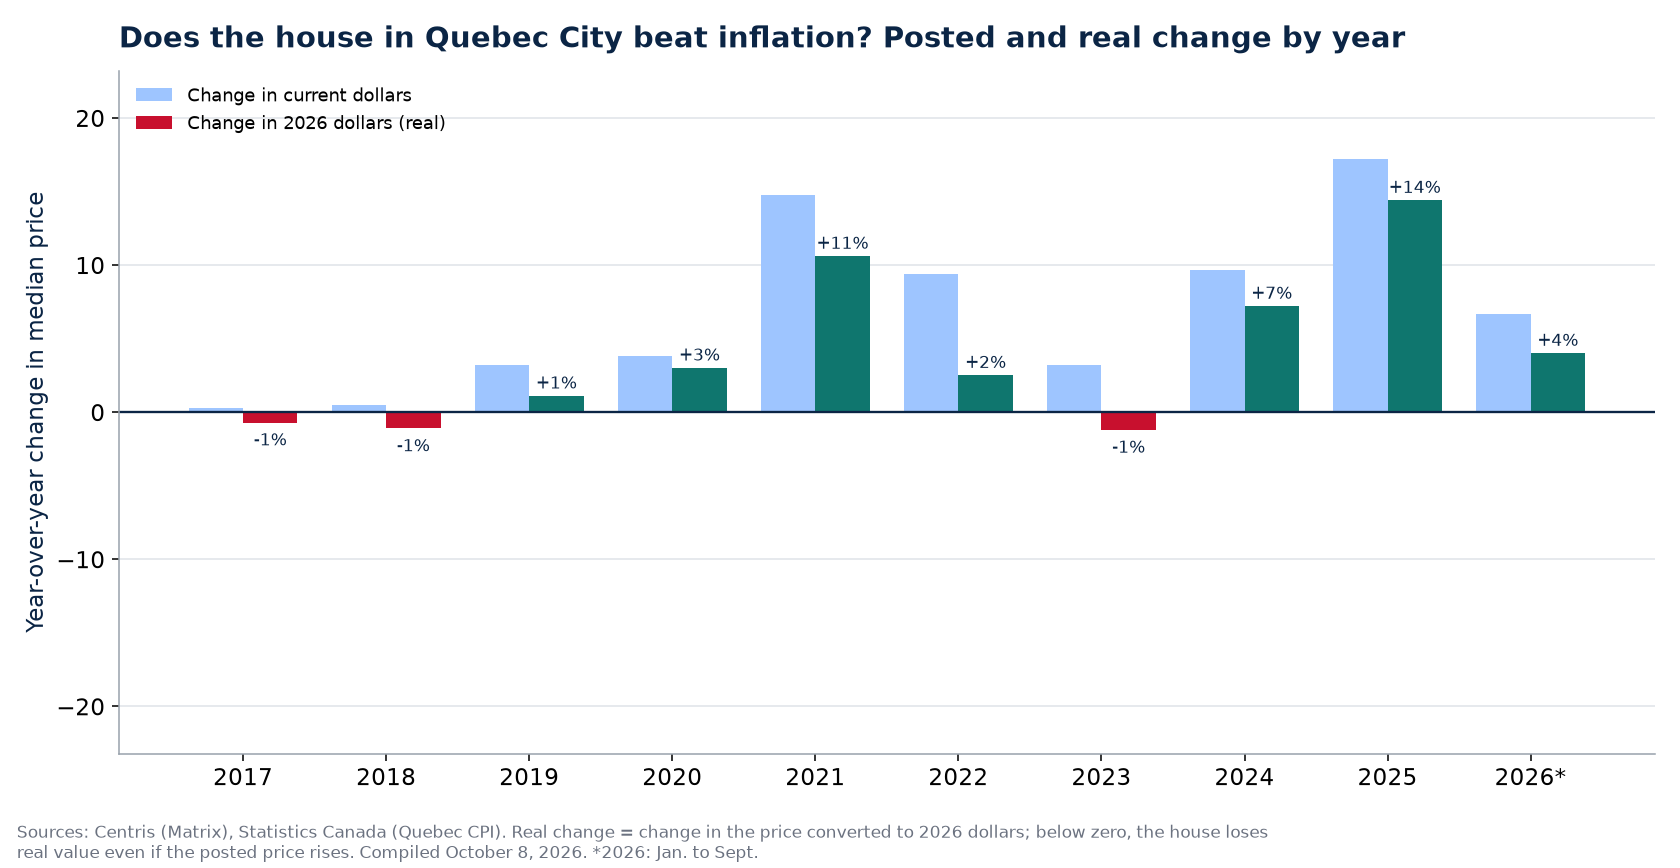
- Ten years: +92% in current dollars, +46% in 2026 dollars, or 6.7% a year nominal and 3.9% a year above inflation. On the 2016 price, inflation ate $78,822: the house gained $230,000 on paper and $151,178 in purchasing power.
- The peak in constant dollars is 2026 ($480,000 of 2026); 2026 is that peak. Years of real decline: 2017, 2018, 2023; no year of decline in current dollars.
- Since 2021: +55% in current dollars, +29% in constant dollars; since 2022: +42% against +26%. The inflation of 2022 (6.7%) and 2023 (4.5%) absorbed a good part of the posted increases.
- The median condo in Quebec City: $194,500 in 2016 ($255,823 of 2026) and $335,000 in 2026, +31% in constant dollars against +46% for the house.
- Across the 50 cities tracked, the median nominal increase is +124% and the real increase +70% since 2016; since 2022, +6% in real terms. The house fell in constant dollars in 2023 in 40 cities, and 17 cities are still below their real peak; 11 have lost real value since 2022.
What it changes for buying or selling in Quebec City
In Quebec City, the ten-year increase is largely inflation: +92% posted, +46% of true gain. An owner who bought in 2016 gained purchasing power, but less than the price curve suggests, and one who bought in 2022 gained almost nothing in constant dollars. For a seller, it means the asking price must follow recent sales and not the memory of 2022; for a buyer, it is a market where the real price is stable, so the choice of house matters more than the choice of timing. What the house gained by year bought, in current dollars, is in house appreciation in Quebec City; the monthly payment it takes today, in mortgage payment in Quebec City.
How to read these figures
One price per year for all of Quebec City, twice: as posted, and as it is worth in today's dollars. The second is the only one that says whether an owner got richer: if the house and groceries rise by the same percentage, nobody gained. The CPI is Quebec's, not the city's; local differences in the cost of living are not taken into account. The median moves from one year to the next with the mix of houses sold, especially in small cities: read three or four year trends, not a single year.
Frequently asked questions
How much has the house really risen in Quebec City since 2016?
+46% in constant dollars ($328,822 of 2026 in 2016 against $480,000 in 2026), for a posted increase of +92%. Quebec inflation was 31.5% over the period.
Is the house losing real value in Quebec City since 2022?
No: +26% in constant dollars since 2022, on top of 12.4% inflation. The real peak is 2026.
Why adjust prices for inflation?
Because inflation is the true benchmark. An investment that makes +92% in ten years while the cost of living rises 31.5% returns +46% of purchasing power, or 3.9% a year; that is the figure to compare with a TFSA or with rent, not the posted curve.
Sources: Centris (Matrix), Statistics module, September 16, 2026 query for the municipality of Quebec City, median sale price of single-family houses and condos by year; Statistics Canada, table 18-10-0004, all-items consumer price index, Quebec, annual average; compiled by the Loaa & Manseur team, aggregates only, current year partial. The inflation-adjusted prices in 50 cities hub compares the 50 cities.
Our other data series in Quebec City, from the same Centris listings:
Each series is recalculated from actual sales, aggregates only.
Our proof, not our promises
The Loaa & Manseur team, led by Lotfi Manseur and Loaa Al Daow, is the number 1 team at RE/MAX Platine in 2024 and 2025, 6th RE/MAX team in Quebec, 15th in Canada and in the global top 50 of large residential teams according to the official RE/MAX ranking, computed on actual transactions. Its Google profile counts more than 220 reviews with a 4.9 rating. Its offices are at 55 avenue de l'Équinoxe in Brossard, one bridge from the island, and every broker's licence can be checked in the OACIQ public register. Three things to verify yourself before calling us, and to demand of any other broker.
Also available in French: version française de ce guide.
Published September 7, 2026 by the Loaa & Manseur team, the number 1 team at RE/MAX Platine in 2024 and 2025, 6th RE/MAX team in Quebec, 15th in Canada and in the global top 50 according to the official RE/MAX ranking. Tell us about your project.