Houses at $1M and up · Westmount · 2016-2026
The number of houses sold for one million dollars and up in Westmount every year since 2016, their share of sales, the first year with ten sales and what you pay above the million. Centris sales, nothing estimated.
In Westmount, 125 houses sold for one million dollars or more from January to September 2026, or 91% of the 137 sales; over the whole of 2025, 157 (78%). In 2016, 153 had sold at that level (68%); in 2021, 147 (78%). The number of sales at one million and up was multiplied by 1.0 between 2016 and 2025. The first year with at least ten sales at that level is 2016. The median house, all prices combined, is worth $2,272,500 (+65% since 2016); the one that sells for a million and up is worth $2,300,000 in median, against $1,500,000 in 2016. It is one of the most active million-dollar markets among the 34 cities tracked (median share 11%). Source: Centris (Matrix), compiled October 10, 2026.
The short answer
In Westmount, 125 houses sold for one million dollars or more from January to September 2026, or 91% of the 137 sales; over the whole of 2025, 157 (78%). In 2016, 153 had sold at that level (68%); in 2021, 147 (78%). The number of sales at one million and up was multiplied by 1.0 between 2016 and 2025. The first year with at least ten sales at that level is 2016. The median house, all prices combined, is worth $2,272,500 (+65% since 2016); the one that sells for a million and up is worth $2,300,000 in median, against $1,500,000 in 2016. It is one of the most active million-dollar markets among the 34 cities tracked (median share 11%).
Sales at one million and up by year
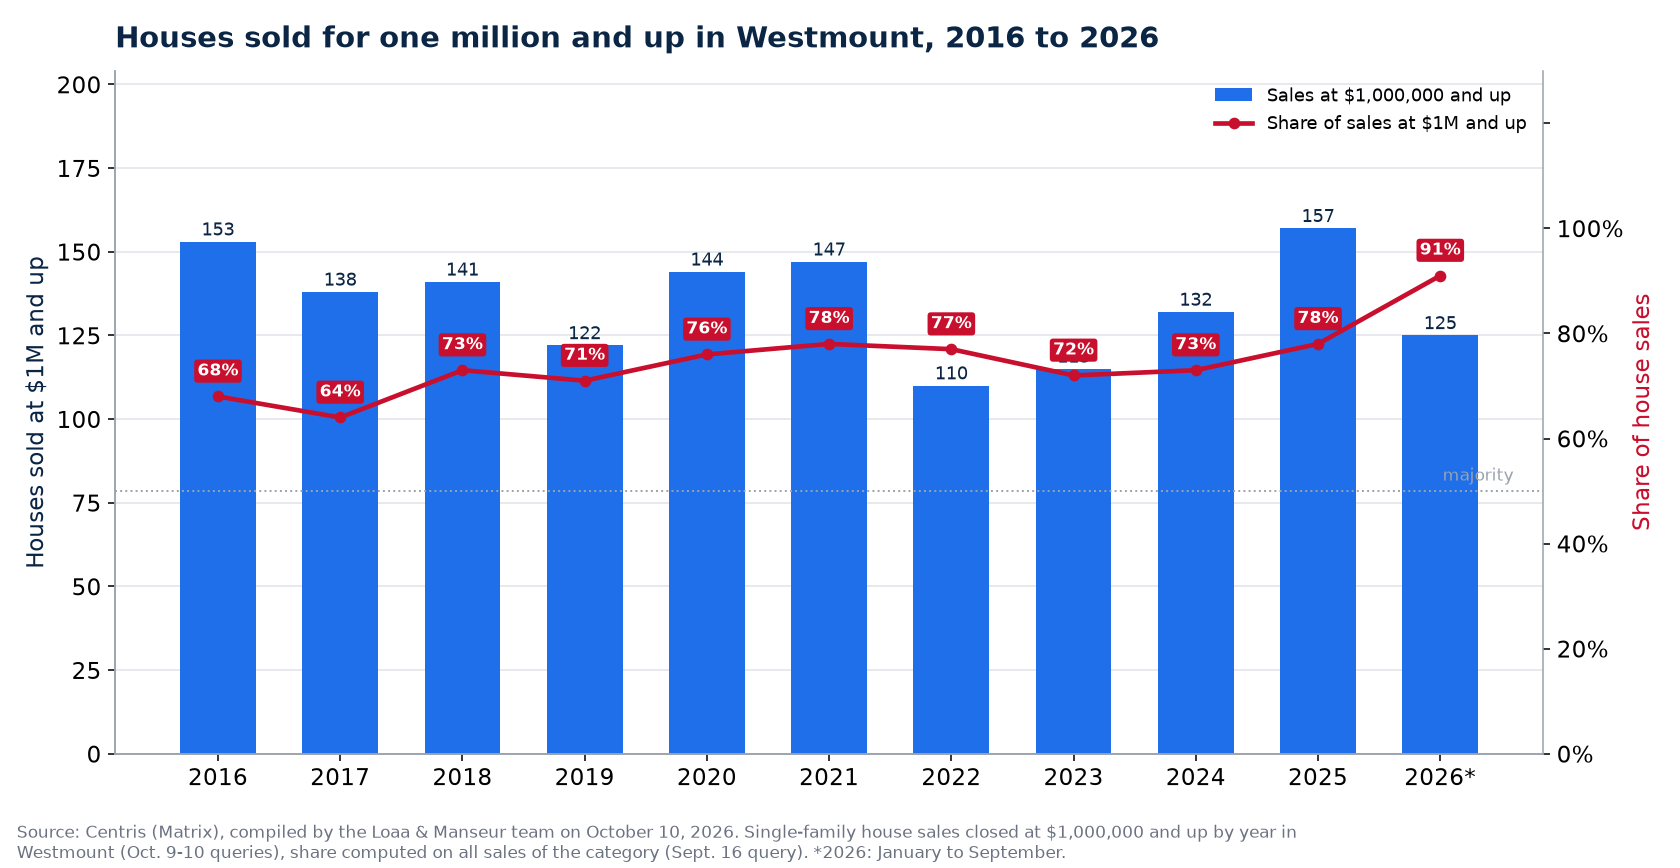
| Year | Sales (all) | $1M and up | Share | Segment median | Median house |
|---|---|---|---|---|---|
| 2016 | 226 | 153 | 68% | $1,500,000 | $1,375,000 |
| 2017 | 214 | 138 | 64% | $1,692,500 | $1,550,000 |
| 2018 | 192 | 141 | 73% | $1,723,800 | $1,700,000 |
| 2019 | 171 | 122 | 71% | $1,825,000 | $1,795,000 |
| 2020 | 190 | 144 | 76% | $2,050,000 | $2,020,500 |
| 2021 | 188 | 147 | 78% | $1,995,000 | $1,992,500 |
| 2022 | 142 | 110 | 77% | $2,385,000 | $2,385,000 |
| 2023 | 159 | 115 | 72% | $2,040,000 | $2,040,000 |
| 2024 | 182 | 132 | 73% | $2,190,000 | $2,175,000 |
| 2025 | 200 | 157 | 78% | $2,250,000 | $2,230,000 |
| 2026 (Jan. to Sept.) | 137 | 125 | 91% | $2,300,000 | $2,272,500 |
Number of sales and median price by year, Single-family category, sale price criterion $1,000,000 and up, Centris (Matrix), October 9-10, 2026 harvest; all houses: September 16 query. 2026: January to September.
What ten years of sales say in Westmount
- Sales at one million and up: 153 in 2016, 147 in 2021, 157 in 2025, 125 from January to September 2026; the peak is 2025 (157); 1,484 sales at that level in ten years in Westmount. As a share of sales: 68% in 2016, 78% in 2021, 91% in 2026.
- What you pay above the million: the segment median is $2,300,000 in 2026 against $1,500,000 in 2016 (+53%), or $27,500 above the city's median house ($2,272,500). A median close to one million says the segment is made of houses that just crossed the bar; a median at 1.3 or 1.5 million says there is a real high-end market.
- The median house in Westmount went from $1,375,000 to $2,272,500 (+65%): it has itself crossed the million, and the segment is no longer a luxury segment but half the market.
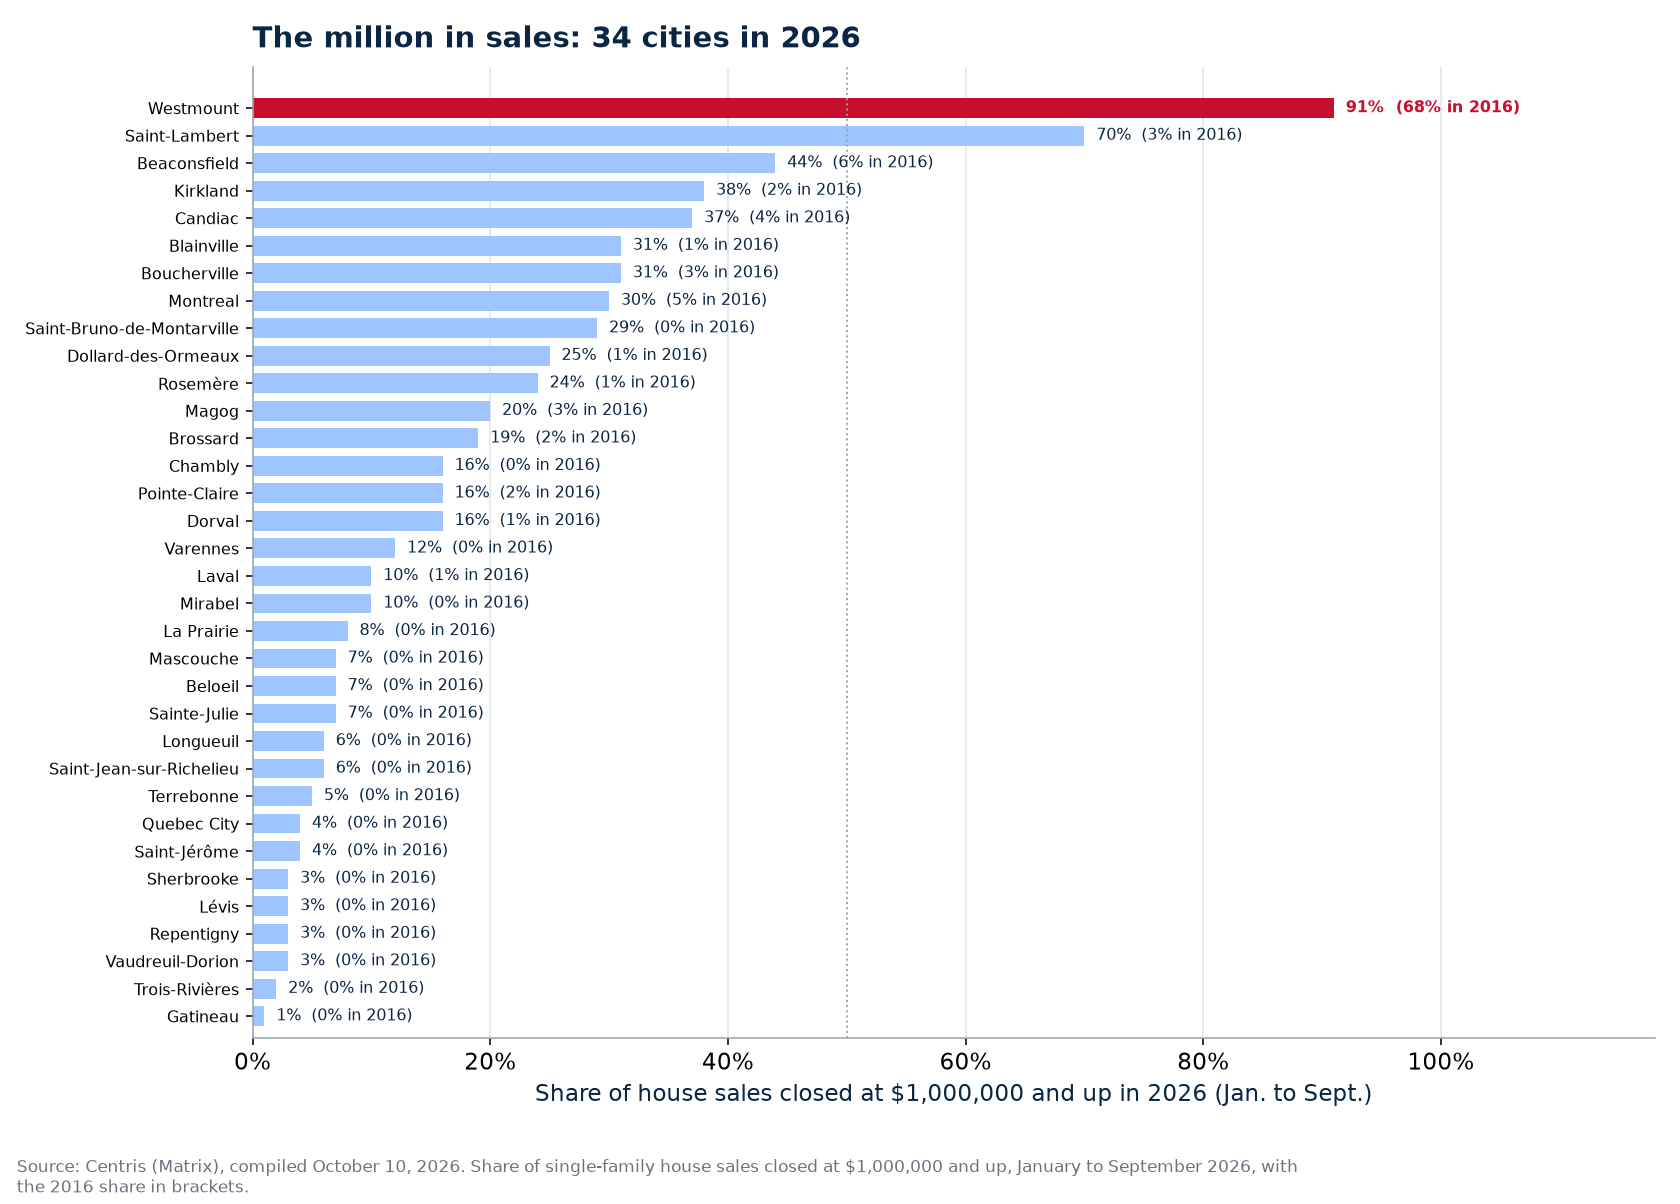
- Across the 34 cities tracked, sales at one million and up went from 456 in 2016 (1.7% of sales) to 1,855 in 2021 (6.3%) and 2,750 in 2025 (9.9%), 6.0 times more in nine years; 10 cities had none in 2016; in 2026, the million is the majority of sales in 2 cities and at least a quarter in 10.
What it changes for buying or selling in Westmount
In Westmount, the million is no longer a ceiling, it is a step: 91% of 2026 sales exceed it, 125 transactions in nine months. Here, the million-dollar house is an ordinary family house, and the luxury market starts higher, around the segment median ($2,300,000). For a seller, listing above the million is not a risk in Westmount, it is the norm, and the time to sell depends on condition and lot more than on price; for a buyer, the million gives access to the middle of the market, not the top, and the 20% down payment ($200,000 and up) closes the door to insured loans. The price of all houses in Westmount is in home prices in Westmount; the down payment needed, in down payment to buy in Westmount.
How to read these figures
One Centris (Matrix) query per city: Single-family category, Asking/sold price criterion of $1,000,000 and up, median sale price and number of sales by year over ten years, whole municipality of Westmount, harvested October 9 and 10, 2026. Total sales and the median house come from the September 16 query on the whole category; the share is the ratio of the two. The criterion applies to the closed sale price, not the asking price.
Frequently asked questions
How many houses sell for over $1 million in Westmount?
125 from January to September 2026, or 91% of house sales in Westmount; 157 over the whole of 2025 (78%). In 2016, 153 sold (68%).
How much does a house over $1 million cost in Westmount?
$2,300,000 in median in 2026 for houses sold at one million and up in Westmount, against $1,500,000 in 2016. The city's median house, all prices combined, is worth $2,272,500.
Why are there so many houses over $1 million in Westmount?
Because the threshold is fixed and prices are not: the median house in Westmount rose +65% in ten years, and each increase pushes a new slice of houses past the million. Across the 34 cities tracked, sales at one million and up were multiplied by 6.0 between 2016 and 2025. Above the million, the insured loan disappears and the minimum down payment is 20%.
Sources: Centris (Matrix), Statistics module, October 9 and 10, 2026 queries for the municipality of Westmount, Single-family category, sale price criterion $1,000,000 and up, number of sales and median price by year; sales and median price of all single-family houses, September 16, 2026 query; compiled by the Loaa & Manseur team, aggregates only, current year partial. The houses over $1 million in 34 cities hub compares the 34 cities.
Our other data series in Westmount, from the same Centris listings:
- Houses under $500,000 in Westmount, ten years
- Average house price in Westmount, ten years
- How long to sell in Westmount, ten years
Each series is recalculated from actual sales, aggregates only.
Our proof, not our promises
The Loaa & Manseur team, led by Lotfi Manseur and Loaa Al Daow, is the number 1 team at RE/MAX Platine in 2024 and 2025, 6th RE/MAX team in Quebec, 15th in Canada and in the global top 50 of large residential teams according to the official RE/MAX ranking, computed on actual transactions. Its Google profile counts more than 220 reviews with a 4.9 rating. Its offices are at 55 avenue de l'Équinoxe in Brossard, one bridge from the island, and every broker's licence can be checked in the OACIQ public register. Three things to verify yourself before calling us, and to demand of any other broker.
Also available in French: version française de ce guide.
Published September 7, 2026 by the Loaa & Manseur team, the number 1 team at RE/MAX Platine in 2024 and 2025, 6th RE/MAX team in Quebec, 15th in Canada and in the global top 50 according to the official RE/MAX ranking. Tell us about your project.