Buying · 36 cities · 2027 forecast
One page per city, same method: CMHC's 2027 forecast for the city's region, and what the city's Centris sales already show in 2026.
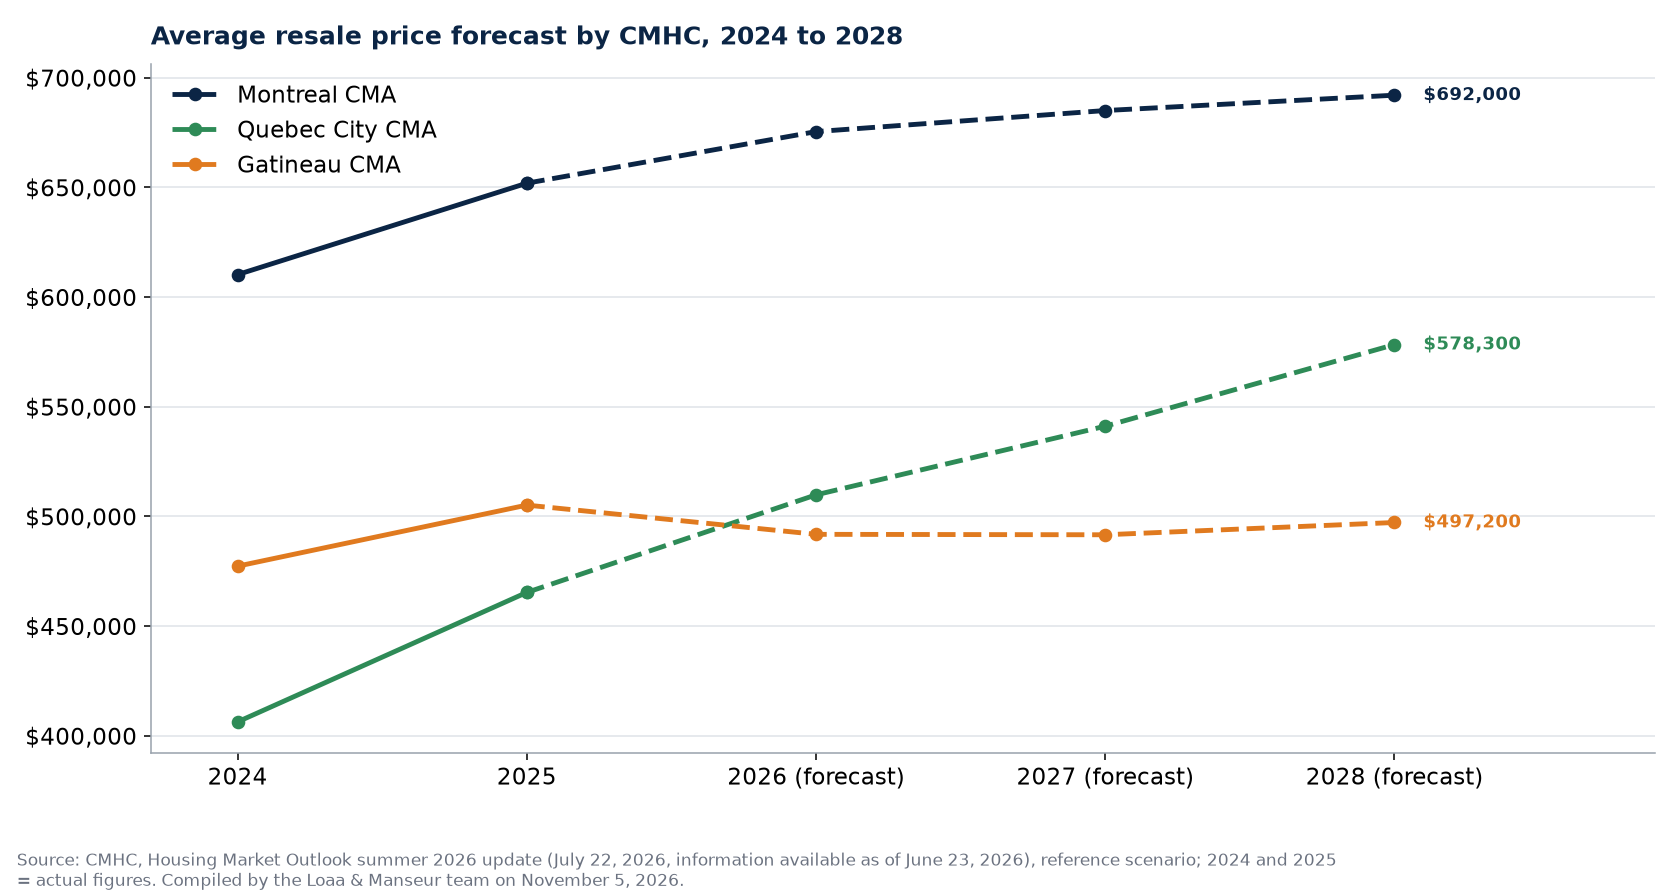
CMHC (summer 2026 update, July 22, 2026) forecasts for 2027 an average resale price of $685,000 in the Montreal region (+1.4%), $541,100 in the Quebec City region (+6.1%) and $491,600 in the Gatineau region (0%); in Canada, $698,900 (+3.5%). The rental vacancy rate would rise to 4.5% in Montreal (2.9% in 2025), 3.9% in Quebec City and 4.9% in Gatineau, but rents would keep rising. In the 36 cities of these regions tracked on Centris, the median house changed by +3.8% on average in 2026 versus 2025 (median of cities), up in 30 cities, and sales fell in 27. CMHC does not publish city-level forecasts. Compiled by the Loaa & Manseur team on November 5, 2026.
What CMHC forecasts for 2027
| Region | Average price 2026 (forecast) | Average price 2027 (forecast) | Sales 2027 | Vacancy 2025 → 2027 | 2-bedroom rent 2027 |
|---|---|---|---|---|---|
| Montreal CMA | $675,400 | $685,000 (+1.4%) | 46,500 (+2.4%) | 2.9% → 4.5% | $1,455 |
| Quebec City CMA | $509,800 | $541,100 (+6.1%) | 9,800 (-1.0%) | 2.4% → 3.9% | $1,330 |
| Gatineau CMA | $491,800 | $491,600 (0%) | 4,600 (+7.0%) | 3.8% → 4.9% | $1,520 |
CMHC, Housing Market Outlook summer 2026 update (July 22, 2026, information available as of June 23, 2026), reference scenario. CMHC does not publish forecasts for Sherbrooke, Trois-Rivieres, Saguenay or other cities outside these three regions.
The 36 cities: what 2026 already shows
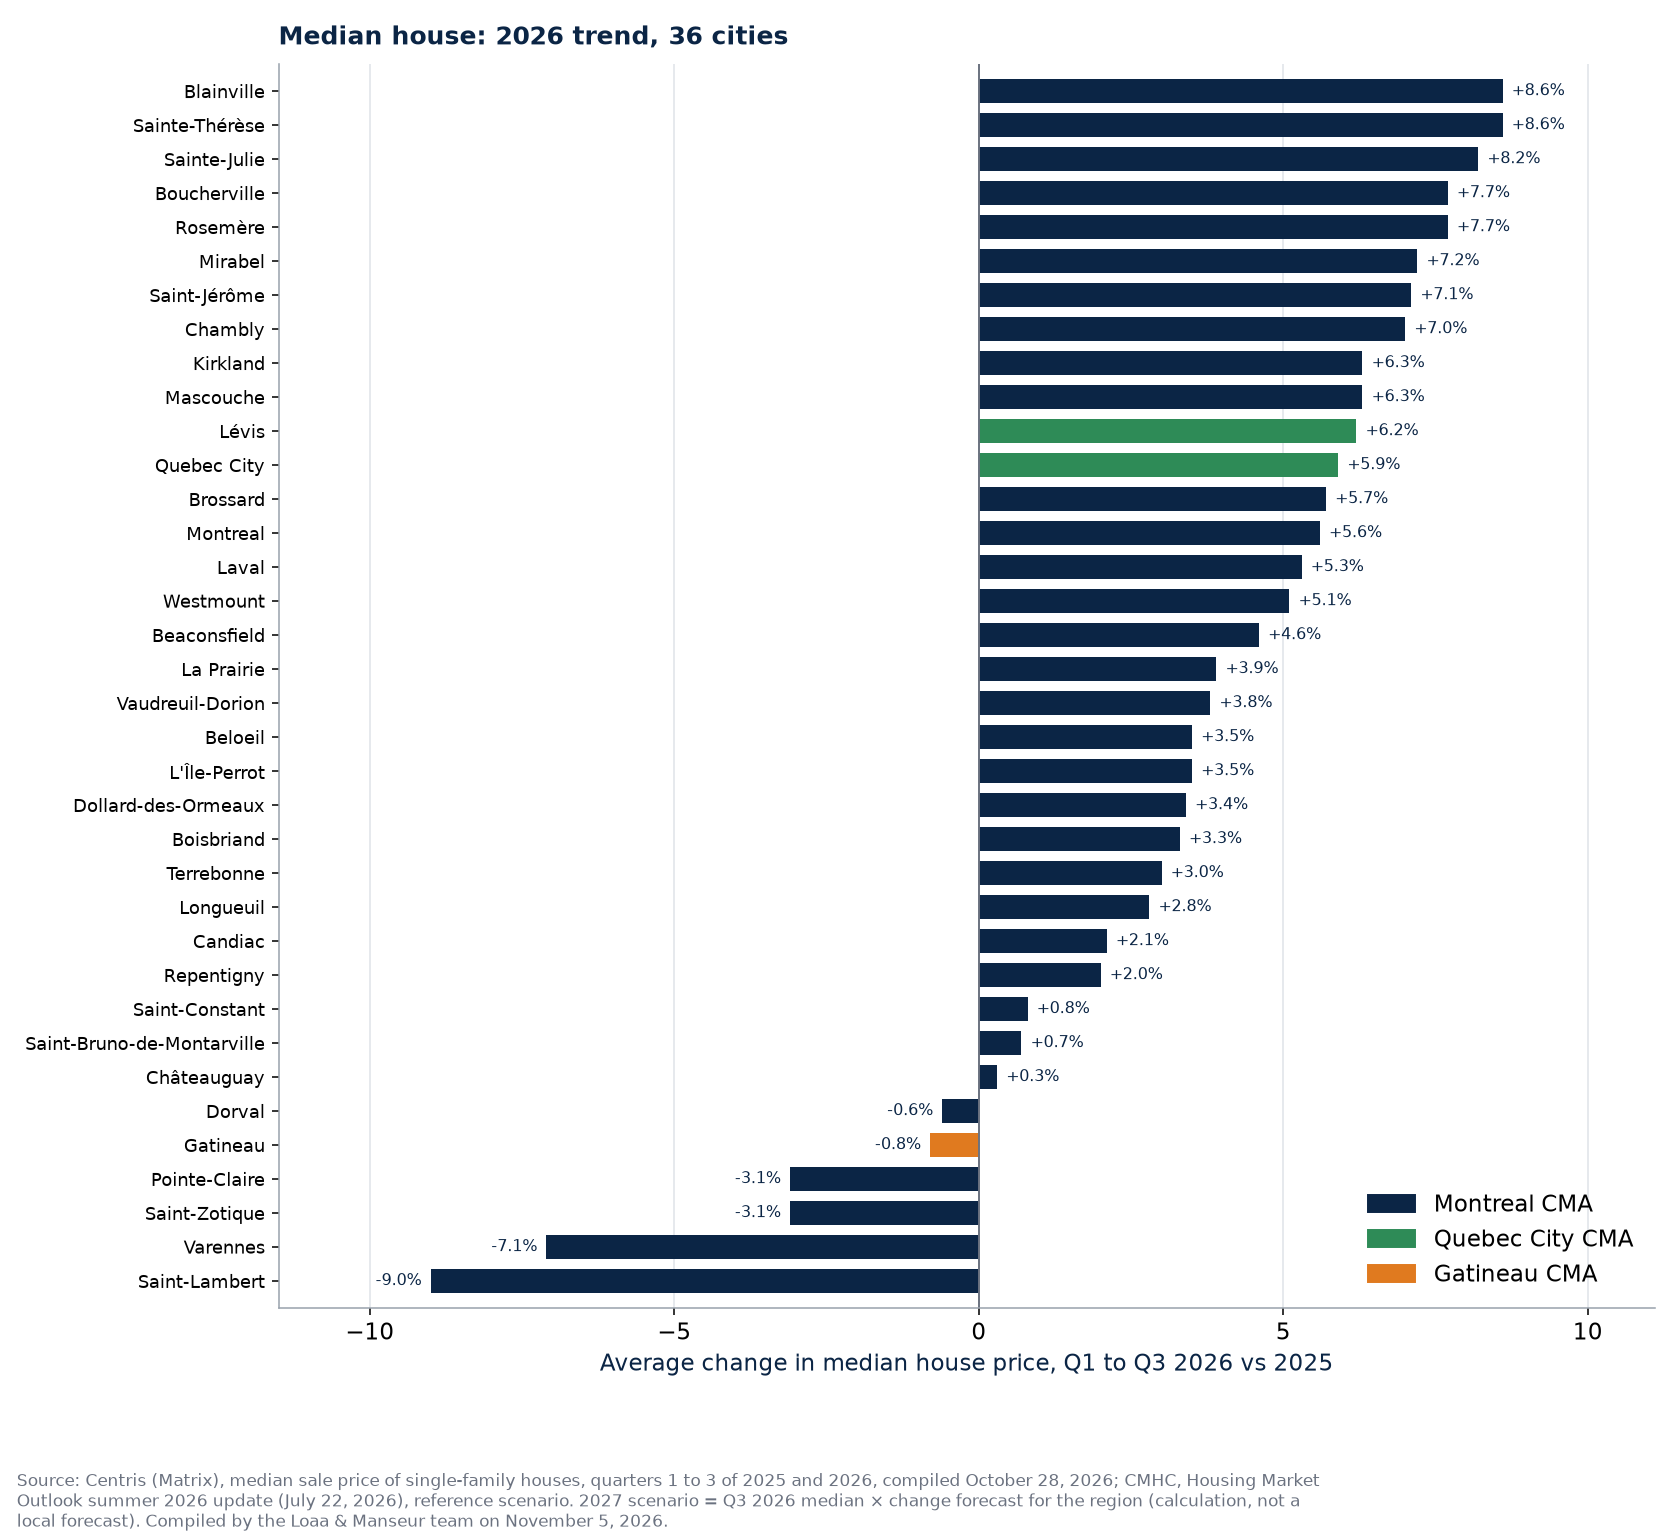
Median single-family house in the third quarter of 2026, average 2026 change versus 2025 (quarters 1 to 3), change in sales of all property types, CMHC forecast for the region and 2027 scenario (calculation).
| City | Area | Median house Q3 2026 | 2026 trend | 2026 sales | CMHC 2027 forecast (region) | 2027 scenario (calculation) |
|---|---|---|---|---|---|---|
| Blainville | North Shore | $832,000 | +8.6% | +4.2% | +1.4% | $844,000 |
| Sainte-Thérèse | North Shore | $710,000 | +8.6% | -8.8% | +1.4% | $720,000 |
| Sainte-Julie | South Shore | $690,000 | +8.2% | -8.9% | +1.4% | $700,000 |
| Boucherville | South Shore | $838,750 | +7.7% | -3.4% | +1.4% | $850,000 |
| Rosemère | North Shore | $958,000 | +7.7% | -11.8% | +1.4% | $971,000 |
| Mirabel | North Shore | $650,000 | +7.2% | -4.4% | +1.4% | $659,000 |
| Saint-Jérôme | North Shore | $540,000 | +7.1% | -11.2% | +1.4% | $548,000 |
| Chambly | South Shore | $740,000 | +7.0% | +11.5% | +1.4% | $750,000 |
| Kirkland | Island of Montreal | $1,005,000 | +6.3% | -4.7% | +1.4% | $1,019,000 |
| Mascouche | North Shore | $600,000 | +6.3% | -2.4% | +1.4% | $608,000 |
| Lévis | South Shore of Quebec City | $449,000 | +6.2% | +1.8% | +6.1% | $476,000 |
| Quebec City | Quebec City | $460,000 | +5.9% | +1.5% | +6.1% | $488,000 |
| Brossard | South Shore | $739,500 | +5.7% | -10.6% | +1.4% | $750,000 |
| Montreal | Island of Montreal | $735,000 | +5.6% | -2.0% | +1.4% | $745,000 |
| Laval | Laval | $630,000 | +5.3% | -6.6% | +1.4% | $639,000 |
| Westmount | Island of Montreal | $2,525,000 | +5.1% | +0.9% | +1.4% | $2,560,000 |
| Beaconsfield | Island of Montreal | $960,000 | +4.6% | -14.9% | +1.4% | $973,000 |
| La Prairie | South Shore | $673,500 | +3.9% | +13.7% | +1.4% | $683,000 |
| Vaudreuil-Dorion | Vaudreuil-Soulanges | $620,250 | +3.8% | -2.6% | +1.4% | $629,000 |
| Beloeil | South Shore | $637,500 | +3.5% | +8.4% | +1.4% | $646,000 |
| L'Île-Perrot | Vaudreuil-Soulanges | $611,000 | +3.5% | -10.0% | +1.4% | $620,000 |
| Dollard-des-Ormeaux | Island of Montreal | $791,000 | +3.4% | -1.9% | +1.4% | $802,000 |
| Boisbriand | North Shore | $622,500 | +3.3% | -34.0% | +1.4% | $631,000 |
| Terrebonne | North Shore | $604,000 | +3.0% | -11.0% | +1.4% | $612,000 |
| Longueuil | South Shore | $598,000 | +2.8% | -2.1% | +1.4% | $606,000 |
| Candiac | South Shore | $889,000 | +2.1% | -19.9% | +1.4% | $901,000 |
| Repentigny | North Shore | $589,500 | +2.0% | -2.2% | +1.4% | $598,000 |
| Saint-Constant | South Shore | $574,000 | +0.8% | -0.7% | +1.4% | $582,000 |
| Saint-Bruno-de-Montarville | South Shore | $882,500 | +0.7% | +5.2% | +1.4% | $895,000 |
| Châteauguay | South Shore | $540,000 | +0.3% | -3.2% | +1.4% | $548,000 |
| Dorval | Island of Montreal | $694,000 | -0.6% | -12.1% | +1.4% | $704,000 |
| Gatineau | Outaouais | $469,290 | -0.8% | -8.4% | 0% | $469,000 |
| Pointe-Claire | Island of Montreal | $759,500 | -3.1% | +0.2% | +1.4% | $770,000 |
| Saint-Zotique | Vaudreuil-Soulanges | $519,000 | -3.1% | -18.0% | +1.4% | $526,000 |
| Varennes | South Shore | $643,750 | -7.1% | -2.4% | +1.4% | $653,000 |
| Saint-Lambert | South Shore | $1,120,000 | -9.0% | -11.6% | +1.4% | $1,136,000 |
What the table says
The median house changed by +3.8% on average in 2026 across the 36 cities (median), up in 30 cities, but sales fell in 27 cities. The strongest trend is in Blainville (+8.6%), the weakest in Saint-Lambert (-9.0%). The Quebec City region is the only one where CMHC forecasts a marked increase in 2027 (+6.1%); Gatineau would stay stable and Montreal would rise modestly.
How to read the table
CMHC forecasts cover the average price of all resales in a region; each city's 2027 scenario applies that change to the local third-quarter 2026 median, which is arithmetic, not a local forecast. The forecasts were prepared with information available as of June 23, 2026, before the October 28, 2026 policy rate hike (from 2.25% to 2.5%). The quarter-by-quarter detail is in the 2026 market by quarter and the rate hike's effect in the rate hike, city by city.
Frequently asked questions
Will real estate prices drop in Quebec in 2027?
Not according to CMHC: its reference scenario forecasts +1.4% in the Montreal region, +6.1% in the Quebec City region and 0% in the Gatineau region in 2027. In its alternative scenario, the Montreal region would dip slightly ($669,100, -0.8%).
Will rents drop in 2027?
No. The vacancy rate would rise in all three regions, but the average 2-bedroom rent would keep rising: $1,455 in Montreal, $1,330 in Quebec City and $1,520 in Gatineau in 2027.
My city is not listed?
CMHC only publishes forecasts for certain metropolitan areas. We publish the 36 cities in these regions where Centris sales are numerous enough for a reliable quarterly median. A team broker can profile any area.
Our proof, not our promises
The Loaa & Manseur team, led by Lotfi Manseur and Loaa Al Daow, is the number 1 team at RE/MAX Platine in 2024 and 2025, 6th RE/MAX team in Quebec, 15th in Canada and in the global top 50 of large residential teams according to the official RE/MAX ranking, computed on actual transactions. Its Google profile counts more than 220 reviews with a 4.9 rating. Its offices are at 55 avenue de l'Équinoxe in Brossard, one bridge from the island, and every broker's licence can be checked in the OACIQ public register. Three things to verify yourself before calling us, and to demand of any other broker.
Also available in French: version française de ce guide.
Published September 7, 2026 by the Loaa & Manseur team, the number 1 team at RE/MAX Platine in 2024 and 2025, 6th RE/MAX team in Quebec, 15th in Canada and in the global top 50 according to the official RE/MAX ranking. Tell us about your project.