Market · Brossard · Q1 to Q3 2026 vs 2025
Are prices falling in Brossard? Is the market going down? The numbers for Brossard, quarter by quarter, 2026 vs 2025: median price, number of sales, days on market and sold-to-asking.
In Brossard, in Q3 2026 (July to September), the median single-family house sold for $739,500, versus $718,000 in Q3 2025 (+3.0%); the median condo $410,000, versus $420,000 (-2.4%). Out of 6 quarter-by-quarter comparisons (houses and condos), the median price is up in 3 and down in 3. From January to September, 1,361 houses and condos sold in 2026 versus 1,523 in 2025 (-10.6%). A house took 30 days to sell in Q3, versus 28 a year earlier. Source: Centris (Matrix), compiled on October 28, 2026.
The short answer
In Brossard, in Q3 2026 (July to September), the median single-family house sold for $739,500, versus $718,000 in Q3 2025 (+3.0%); the median condo $410,000, versus $420,000 (-2.4%). Out of 6 quarter-by-quarter comparisons (houses and condos), the median price is up in 3 and down in 3. From January to September, 1,361 houses and condos sold in 2026 versus 1,523 in 2025 (-10.6%). A house took 30 days to sell in Q3, versus 28 a year earlier.
Median price by quarter in Brossard: 2026 vs 2025

| Quarter | Houses 2025 | Houses 2026 | Change | Condos 2025 | Condos 2026 | Change |
|---|---|---|---|---|---|---|
| Q1 (January to March) | $669,000 | $738,000 | +10.3% | $420,000 | $405,000 | -3.6% |
| Q2 (April to June) | $706,444 | $732,500 | +3.7% | $418,000 | $400,000 | -4.3% |
| Q3 (July to September) | $718,000 | $739,500 | +3.0% | $420,000 | $410,000 | -2.4% |
- Q1 (January to March): median price single-family house +10.3%, condo -3.6%; house sales -20.3%.
- Q2 (April to June): median price single-family house +3.7%, condo -4.3%; house sales -9.8%.
- Q3 (July to September): median price single-family house +3.0%, condo -2.4%; house sales +1.9%.
Number of sales by quarter
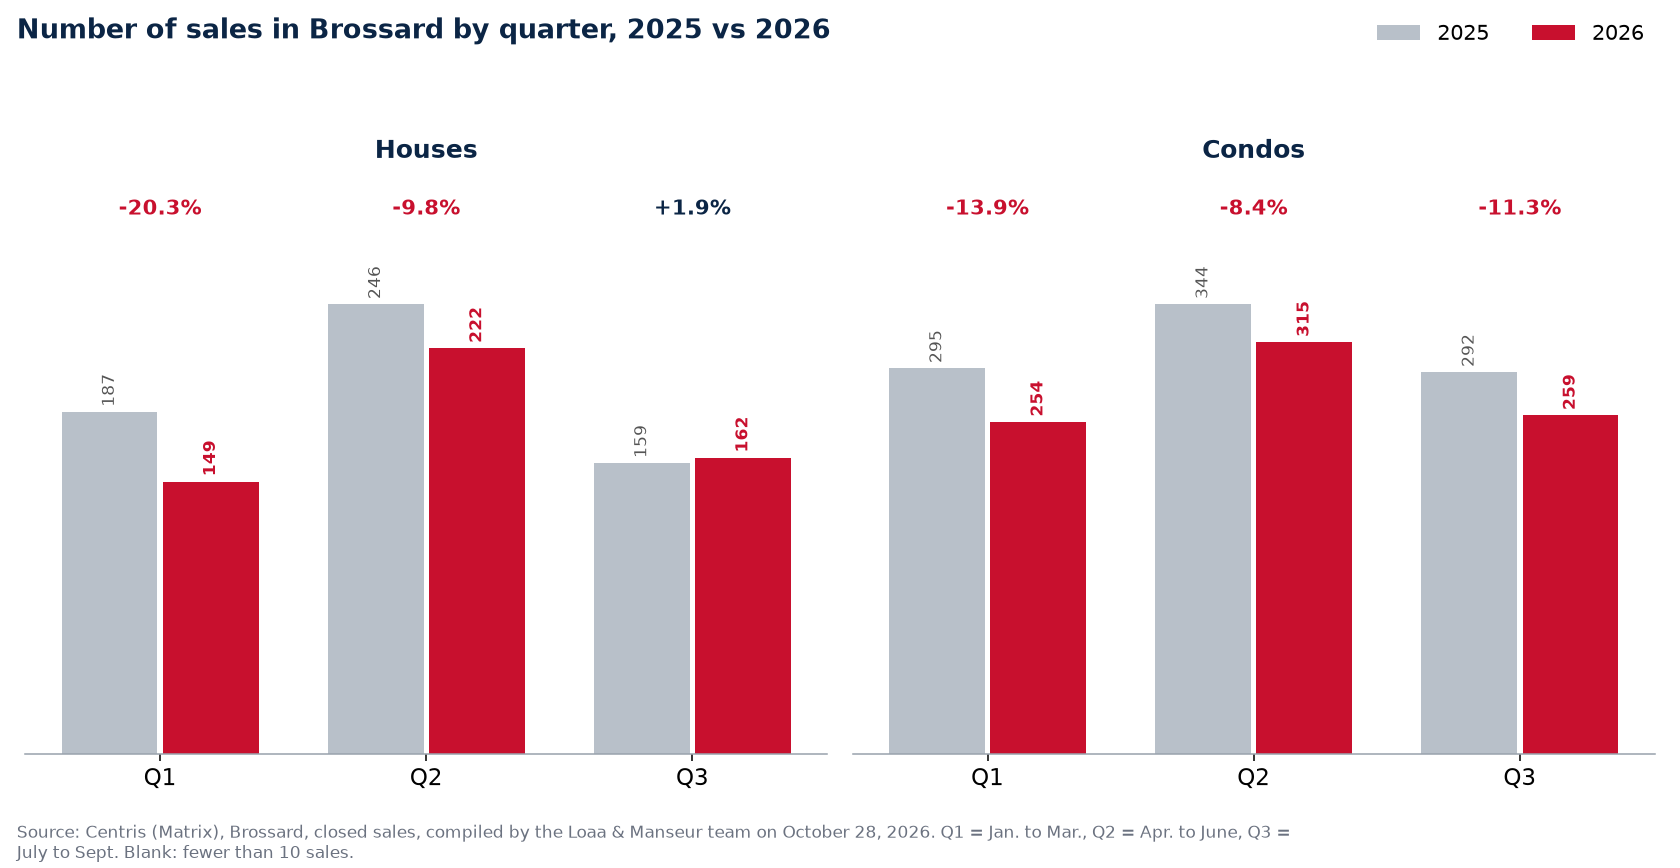
| Quarter | Houses 2025 | Houses 2026 | Change | Condos 2025 | Condos 2026 | Change |
|---|---|---|---|---|---|---|
| Q1 (January to March) | 187 | 149 | -20.3% | 295 | 254 | -13.9% |
| Q2 (April to June) | 246 | 222 | -9.8% | 344 | 315 | -8.4% |
| Q3 (July to September) | 159 | 162 | +1.9% | 292 | 259 | -11.3% |
From January to September, 1,361 houses and condos sold in Brossard in 2026, versus 1,523 in 2025 (-10.6%). By type: 533 houses (-10.0%), 828 condos (-11.1%). The sharpest drop: houses in Q1, 149 sales versus 187 (-20.3%).
Days on market and sold-to-asking price

| Quarter | Houses 2025 | Houses 2026 | Change | Condos 2025 | Condos 2026 | Change |
|---|---|---|---|---|---|---|
| Q1 (January to March) | 26 days | 24 days | -2 days | 34 days | 38 days | +4 days |
| Q2 (April to June) | 17 days | 20 days | +3 days | 22 days | 29 days | +7 days |
| Q3 (July to September) | 28 days | 30 days | +2 days | 35 days | 45 days | +10 days |
In Q3 2026, the median house took 30 days to sell (28 days in 2025); the median condo 45 days (35 days in 2025).
| Quarter | Houses 2025 | Houses 2026 | Change | Condos 2025 | Condos 2026 | Change |
|---|---|---|---|---|---|---|
| Q1 (January to March) | 98% | 98% | stable | 98% | 98% | stable |
| Q2 (April to June) | 98% | 98% | stable | 98% | 98% | stable |
| Q3 (July to September) | 97% | 98% | +1 point | 98% | 98% | stable |
In Q3 2026, house sellers in Brossard got 98% of the asking price at the median. Sold-to-asking is the sale price divided by the last asking price, at the median.
Is the market going down in Brossard?
This is the picture of a market slowing down without price drops: fewer sales than in 2025, houses staying on the market longer, but a median price that holds.
Across Quebec, the median house rose +2.0% in Q3 ($500,000) and sales fell 3.0% from January to September. In Brossard, the median house is +3.0% for the same quarter and sales are -10.6%. That is roughly the provincial pace. See the numbers for all of Quebec by quarter.
What it means for you
If you are buying
For a buyer, a slower market means more choice and more time to visit, inspect and negotiate conditions. Our page on whether it is a buyer’s or seller’s market in Brossard shows who has the upper hand.
If you are selling
Prices are holding, but selling takes longer. A property listed at the right price from day one still sells close to asking; an overpriced one sits, and that is when price cuts come. See also days on market in Brossard since 2016.
How to read these numbers
Centris (Matrix) statistics for all of Brossard, closed sales. House: Single-family category, all styles. Condo: Divided co-ownership category. Plex: Income property category. A quarter covers sales closed during its three months: Q1 January to March, Q2 April to June, Q3 July to September. The median price is the middle price: half of sales closed above it, half below; it also moves with the mix of properties sold, especially where there are few sales. Fewer than 10 sales in a quarter: median left blank (n/a). Days on market and sold-to-asking are shown for houses and condos.
The policy rate rose to 2.5% on October 28, 2026. The effect in Brossard:
Payment before and after, down payment, minimum income to qualify, with the math.
Frequently asked questions
Are prices going down in Brossard in 2026?
No. The median house sold for $739,500 in Q3 2026, versus $718,000 in Q3 2025 (+3.0%). Out of 6 quarter-by-quarter comparisons (houses and condos), the median price is up in 3 and down in 3.
Are fewer houses selling in Brossard in 2026?
From January to September 2026, 533 houses sold versus 592 in 2025 (-10.0%).
How long does it take to sell a house in Brossard?
30 days at the median in Q3 2026, versus 28 days in Q3 2025. It varies a lot by area and price range.
What about condos in Brossard?
The median condo sold for $410,000 in Q3 2026 (-2.4% year over year), on 259 sales.
What will the market do in 2027?
Nobody knows the future; the numbers above describe what actually sold. For the trends to watch, see our Quebec real estate market forecast for 2027.
Source: Centris (Matrix), Statistics module, Brossard, queries of October 28, 2026, closed sales, median sale price, number of sales, median days on market and sale-to-asking price, by quarter of 2025 and 2026; compiled by the Loaa & Manseur team, aggregates only. Past results do not guarantee the future.
Also available in French: version française de ce guide.
Published September 7, 2026 by the Loaa & Manseur team, the number 1 team at RE/MAX Platine in 2024 and 2025, 6th RE/MAX team in Quebec, 15th in Canada and in the global top 50 according to the official RE/MAX ranking. Tell us about your project.