Market · Le Sud-Ouest (Montreal) · Q1 to Q3 2026 vs 2025
Are prices falling in Le Sud-Ouest? Is the market going down? The numbers for the Le Sud-Ouest borough, quarter by quarter, 2026 vs 2025: median price, number of sales, days on market and sold-to-asking.
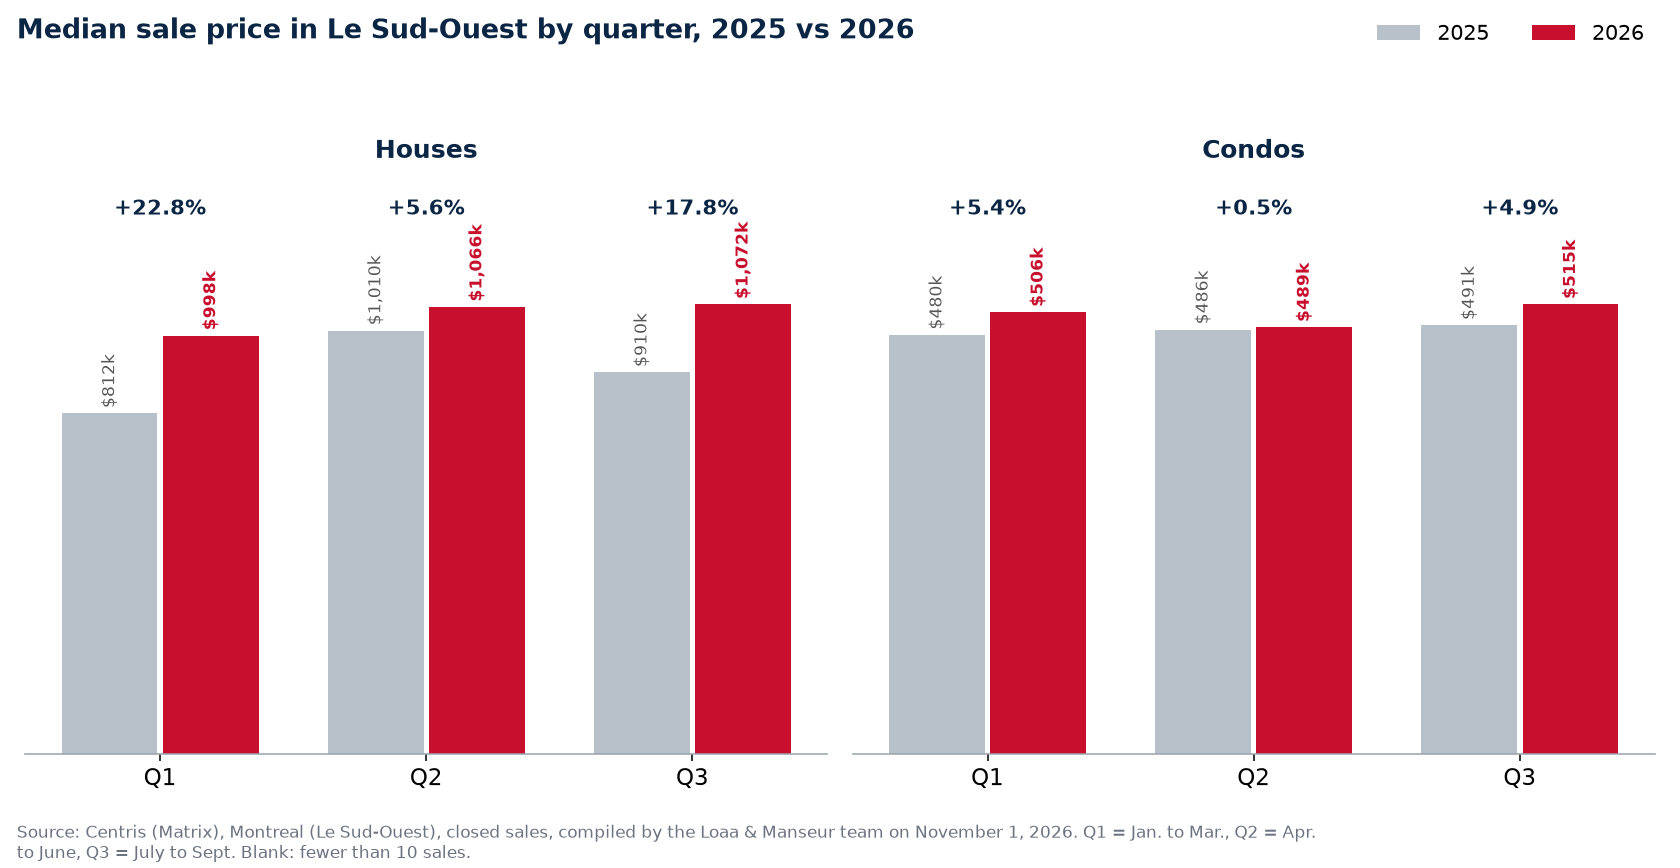
In Le Sud-Ouest, in Q3 2026 (July to September), the median condo sold for $515,000, versus $491,000 in Q3 2025 (+4.9%); the median single-family house $1,072,000, versus $910,000 (+17.8%). No median price is below its 2025 level in any quarter. From January to September, 1,738 houses and condos sold in 2026 versus 1,906 in 2025 (-8.8%). A condo took 45 days to sell in Q3, versus 34 a year earlier. Source: Centris (Matrix), compiled on November 1, 2026.
The short answer
In Le Sud-Ouest, in Q3 2026 (July to September), the median condo sold for $515,000, versus $491,000 in Q3 2025 (+4.9%); the median single-family house $1,072,000, versus $910,000 (+17.8%). No median price is below its 2025 level in any quarter. From January to September, 1,738 houses and condos sold in 2026 versus 1,906 in 2025 (-8.8%). A condo took 45 days to sell in Q3, versus 34 a year earlier.
Median price by quarter in Le Sud-Ouest: 2026 vs 2025
| Quarter | Houses 2025 | Houses 2026 | Change | Condos 2025 | Condos 2026 | Change |
|---|---|---|---|---|---|---|
| Q1 (January to March) | $812,000 | $997,500 | +22.8% | $480,000 | $506,000 | +5.4% |
| Q2 (April to June) | $1,009,500 | $1,066,000 | +5.6% | $486,000 | $488,650 | +0.5% |
| Q3 (July to September) | $910,000 | $1,072,000 | +17.8% | $491,000 | $515,000 | +4.9% |
- Q1 (January to March): median price single-family house +22.8%, condo +5.4%; condos sales -12.3%.
- Q2 (April to June): median price single-family house +5.6%, condo +0.5%; condos sales -6.3%.
- Q3 (July to September): median price single-family house +17.8%, condo +4.9%; condos sales -5.2%.
Number of sales by quarter

| Quarter | Houses 2025 | Houses 2026 | Change | Condos 2025 | Condos 2026 | Change |
|---|---|---|---|---|---|---|
| Q1 (January to March) | 23 | 21 | -8.7% | 544 | 477 | -12.3% |
| Q2 (April to June) | 34 | 24 | -29.4% | 748 | 701 | -6.3% |
| Q3 (July to September) | 33 | 18 | -45.5% | 524 | 497 | -5.2% |
From January to September, 1,738 houses and condos sold in Le Sud-Ouest in 2026, versus 1,906 in 2025 (-8.8%). By type: 63 houses (-30.0%), 1,675 condos (-7.8%). The sharpest drop: houses in Q3, 18 sales versus 33 (-45.5%).
Days on market and sold-to-asking price

| Quarter | Houses 2025 | Houses 2026 | Change | Condos 2025 | Condos 2026 | Change |
|---|---|---|---|---|---|---|
| Q1 (January to March) | 33 days | 9 days | -24 days | 33 days | 42 days | +9 days |
| Q2 (April to June) | 18 days | 22 days | +4 days | 27 days | 30 days | +3 days |
| Q3 (July to September) | 50 days | 27 days | -23 days | 34 days | 45 days | +11 days |
In Q3 2026, the median house took 27 days to sell (50 days in 2025); the median condo 45 days (34 days in 2025).
| Quarter | Houses 2025 | Houses 2026 | Change | Condos 2025 | Condos 2026 | Change |
|---|---|---|---|---|---|---|
| Q1 (January to March) | 97% | 100% | +3 points | 98% | 98% | stable |
| Q2 (April to June) | 97% | 100% | +3 points | 98% | 98% | stable |
| Q3 (July to September) | 97% | 98% | +1 point | 98% | 97% | -1 point |
In Q3 2026, condos sellers in Le Sud-Ouest got 97% of the asking price at the median. Sold-to-asking is the sale price divided by the last asking price, at the median.
Is the market going down in Le Sud-Ouest?
This is the picture of a market slowing down without price drops: fewer sales than in 2025, properties staying on the market longer, but a median price that holds.
For Montreal as a whole, the median condo is +1.1% in Q3 2026 ($475,000) and January-to-September sales are -2.0%. In Le Sud-Ouest, the median condo is +4.9% ($515,000) and sales are -8.8%. Prices are rising faster in this borough than in the city as a whole. See the numbers for Montreal by quarter.
What it means for you
If you are buying
For a buyer, a slower market means more choice and more time to visit, inspect and negotiate conditions. To place Le Sud-Ouest within Montreal, see the Montreal market by quarter.
If you are selling
Prices are holding, but selling takes longer. A property listed at the right price from day one still sells close to asking; an overpriced one sits, and that is when price cuts come. See also days on market in Le Sud-Ouest since 2016.
How to read these numbers
Centris (Matrix) statistics for the Le Sud-Ouest borough of Montreal, closed sales. House: Single-family category, all styles. Condo: Divided co-ownership category. A quarter covers sales closed during its three months: Q1 January to March, Q2 April to June, Q3 July to September. The median price is the middle price: half of sales closed above it, half below; it also moves with the mix of properties sold, especially where there are few sales. Fewer than 10 sales in a quarter: median, days on market and sold-to-asking left blank (n/a).
Frequently asked questions
Are prices going down in Le Sud-Ouest in 2026?
No. The median condo sold for $515,000 in Q3 2026, versus $491,000 in Q3 2025 (+4.9%). No median price is below its 2025 level in any quarter.
Are fewer properties selling in Le Sud-Ouest in 2026?
From January to September 2026, 1,738 houses and condos sold versus 1,906 in 2025 (-8.8%).
How long does it take to sell in Le Sud-Ouest?
In Q3 2026, the median house took 27 days to sell (50 days in 2025); the median condo 45 days (34 days in 2025). It varies a lot by street, property style and price range.
How does Le Sud-Ouest compare with the rest of Montreal?
For Montreal as a whole, the median condo is +1.1% in Q3 2026 ($475,000) and January-to-September sales are -2.0%. In Le Sud-Ouest, the median condo is +4.9% ($515,000) and sales are -8.8%. Prices are rising faster in this borough than in the city as a whole. See the numbers for Montreal by quarter.
What will the market do in 2027?
Nobody knows the future; the numbers above describe what actually sold. For the trends to watch, see our Quebec real estate market forecast for 2027.
Source: Centris (Matrix), Statistics module, Montreal (Le Sud-Ouest), queries of November 1, 2026, closed sales, median sale price, number of sales, median days on market and sale-to-asking price, by quarter of 2025 and 2026; compiled by the Loaa & Manseur team, aggregates only. Past results do not guarantee the future.
Also available in French: version française de ce guide.
Published September 7, 2026 by the Loaa & Manseur team, the number 1 team at RE/MAX Platine in 2024 and 2025, 6th RE/MAX team in Quebec, 15th in Canada and in the global top 50 according to the official RE/MAX ranking. Tell us about your project.