Market · Real estate vs inflation · 20 years
Twenty years of home prices in Québec, Canada and the United States, compared with inflation, stocks, gold and GICs. Five charts, both sides of the story, and what it changes for buying or selling in 2026.
From August 2006 to August 2026, the benchmark price of a Québec home went from $183,900 to $540,800 (+194%, 5.5% a year) against +55% for Canadian inflation: 1.9 times more purchasing power. Without leverage, the S&P 500 (×8.5 in US dollars), gold (×7.2) and the TSX 60 (×5.4) did more, but Québec and Montréal homes never fell year over year in 20 years, while Canada fell 6 times, the United States 5 times, the TSX 4 times and the S&P 500 3 times. With a 20% down payment ($36,780), the home is worth $393,680 in 2026 against $311,874 for the S&P 500, before interest, taxes and fees. Sources: CREA, FHFA, Statistics Canada, BLS, Bank of Canada, Yahoo Finance, APCIQ, read on September 16, 2026.
The short answer
From August 2006 to August 2026, the benchmark price of a home in Québec (CREA's MLS Home Price Index) went from $183,900 to $540,800, a gain of 194%, or 5.5% a year. Over the same 20 years, Canadian inflation rose 55% (2.2% a year). In real dollars, a Québec home is worth 1.9 times what it was worth 20 years ago. Canada as a whole gained 136%, the United States 101%.
It is not the highest return out there: without leverage, the S&P 500 with dividends multiplied money by 8.5 (in US dollars), gold by 7.2 and the S&P/TSX 60 by 5.4. But Québec real estate has two things neither stocks nor gold had: zero down years in 20 years (August to August, in Québec and in Montréal), and leverage that, on a 20% down payment, puts the home ahead of every other asset in this comparison. The five charts below show both sides, with official numbers.
1. Homes versus inflation: Québec, Canada, United States
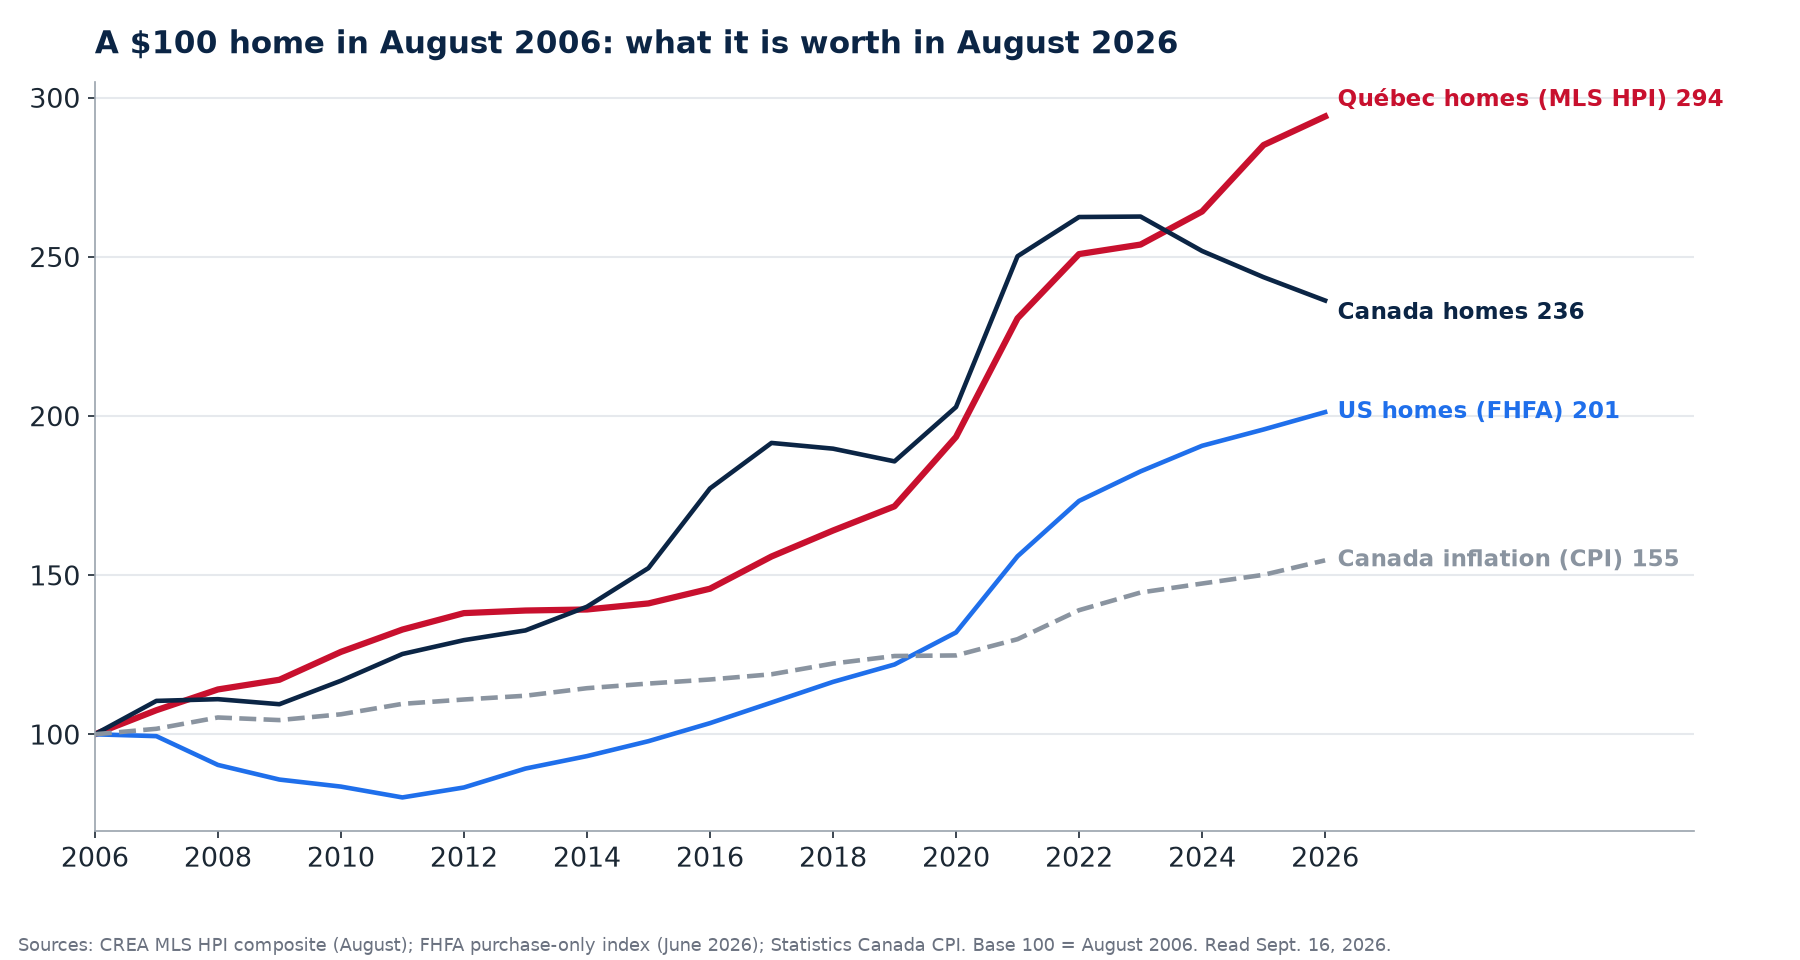
| August 2006 to August 2026 | Start | End | Change | Per year |
|---|---|---|---|---|
| Home, Québec (MLS HPI composite) | $183,900 | $540,800 | +194% | 5.5% |
| Home, Montréal CMA | $198,000 | $583,900 | +195% | 5.6% |
| Home, Québec City CMA | $140,400 | $436,100 | +211% | 5.8% |
| Home, Centre-du-Québec | $86,500 | $362,400 | +319% | 7.4% |
| Home, Canada (MLS HPI composite) | $278,300 | $657,500 | +136% | 4.4% |
| Home, United States (FHFA index, June 2026) | 224.8 | 452.3 | +101% | 3.6% |
| Inflation, Canada (CPI) | 109.8 | 169.8 | +55% | 2.2% |
| Inflation, United States (CPI) | 203.9 | 335.0 | +64% | 2.5% |
What matters for a Québec household: the gap between the home and the cost of living was not a few points, it was 139 points. And the province beat Canada because it never went through the Toronto and Vancouver correction: since August 2022 the Canadian index has been falling ($730,500 to $657,500) while the Québec index kept rising ($461,300 to $540,800). The current market is covered in our Québec real estate market forecast.
2. Without leverage, stocks did better: the chart that must be shown too
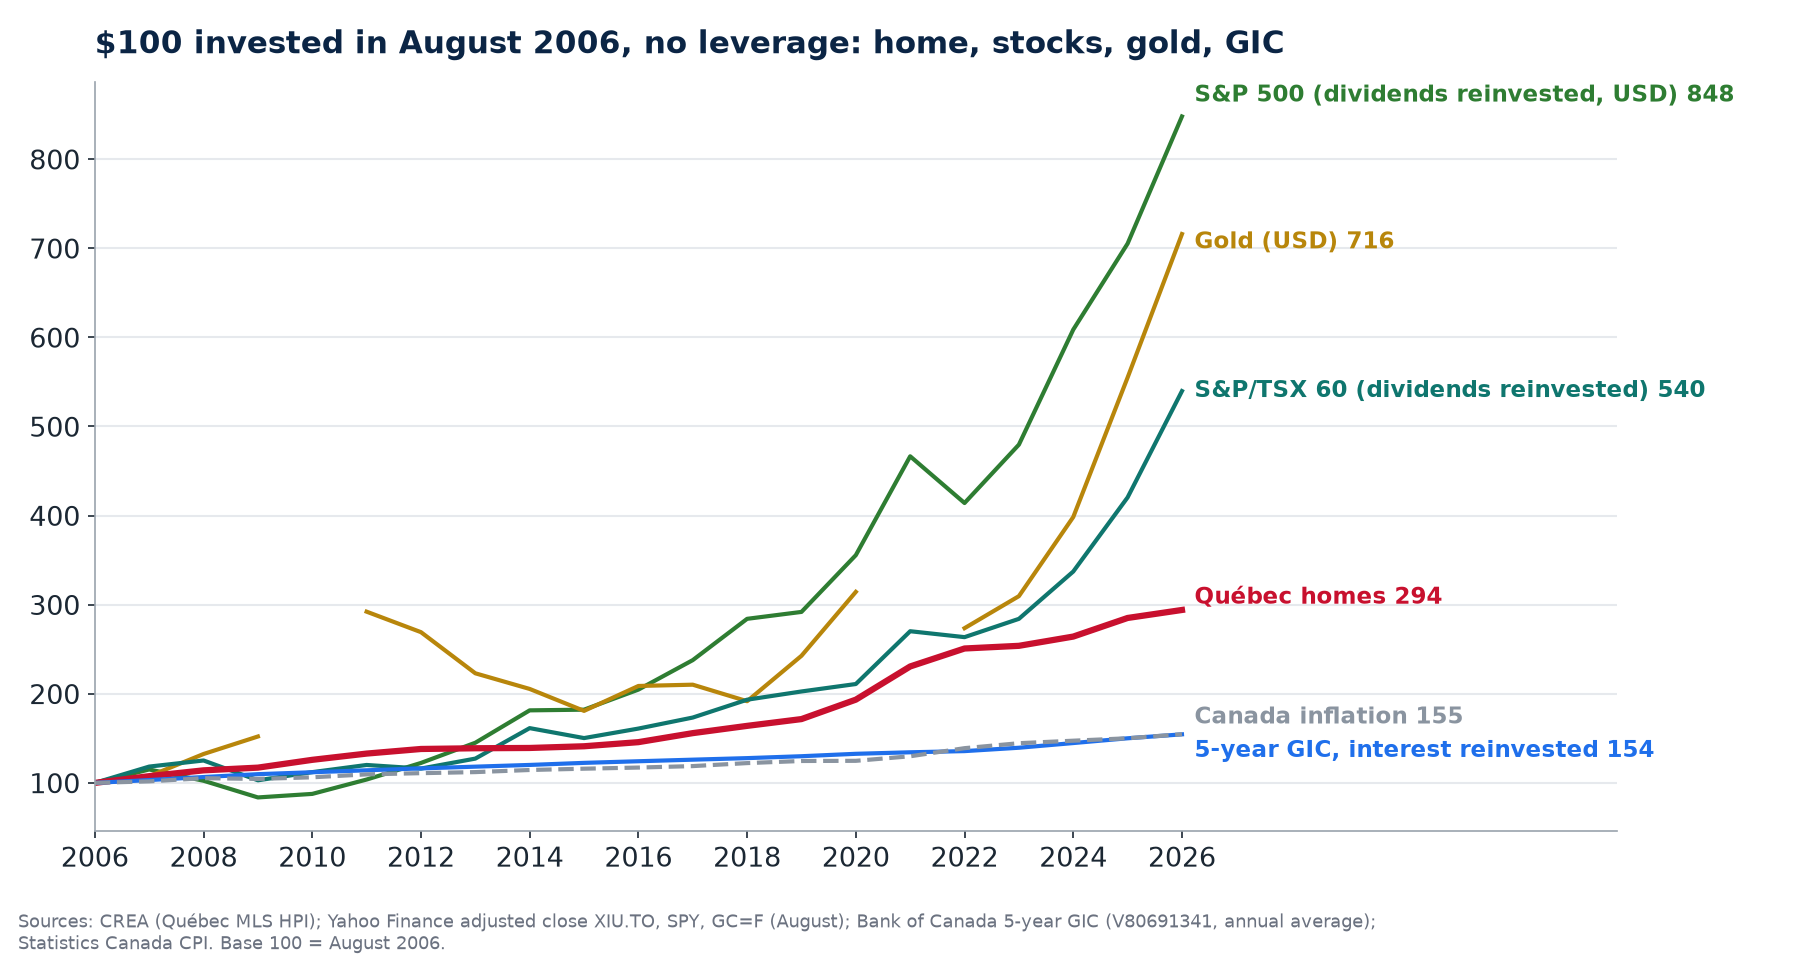
An honest article does not hide this chart. Dollar for dollar and without borrowing, US stocks (11.3% a year, dividends reinvested, in US dollars), gold (10.3%) and Canadian stocks (8.8%) beat the Québec home (5.5%). The 5-year GIC did exactly inflation: 154 against 155. In other words, the "risk-free" savings of 2006 gained nothing in purchasing power over 20 years.
But nobody buys a home in cash, and nobody lives in a stock portfolio. The next three charts show what changes once you account for drawdowns, inflation and the down payment.
3. The real strength of Québec real estate: it never fell in 20 years
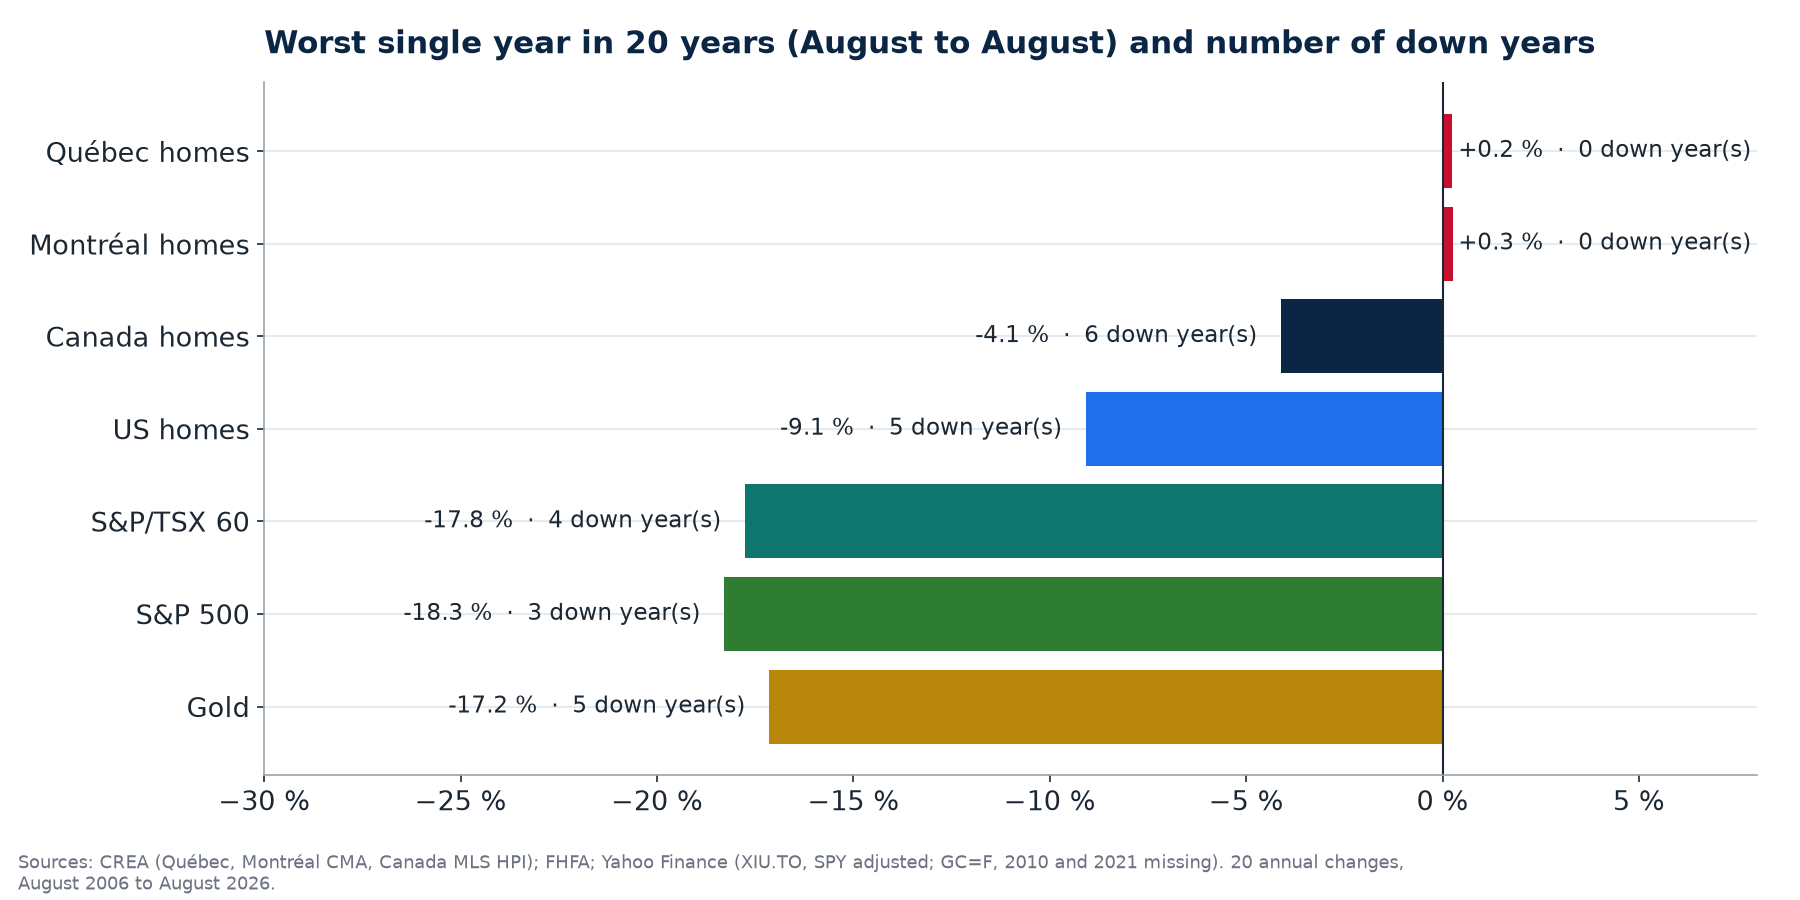
This is the most important number on this page. Over 20 annual readings, the Québec index never posted a year-over-year decline: its worst year was +0.2% (2013 to 2014), and Montréal's +0.3%. In 2009, at the bottom of the financial crisis, the Québec home gained 2.7% while the TSX lost 21% and US homes began five straight years of decline (-20% in total from August 2006 to August 2011).
Stocks finished higher, yes, but through 18% to 21% drops that make people sell at the wrong time. A household does not sell its home because an index moved; it sold its stocks in 2009 and in 2022 far more often than it admits. Stability is not a detail: it is what lets you hold for 20 years.
4. In real dollars: what is left once inflation is removed
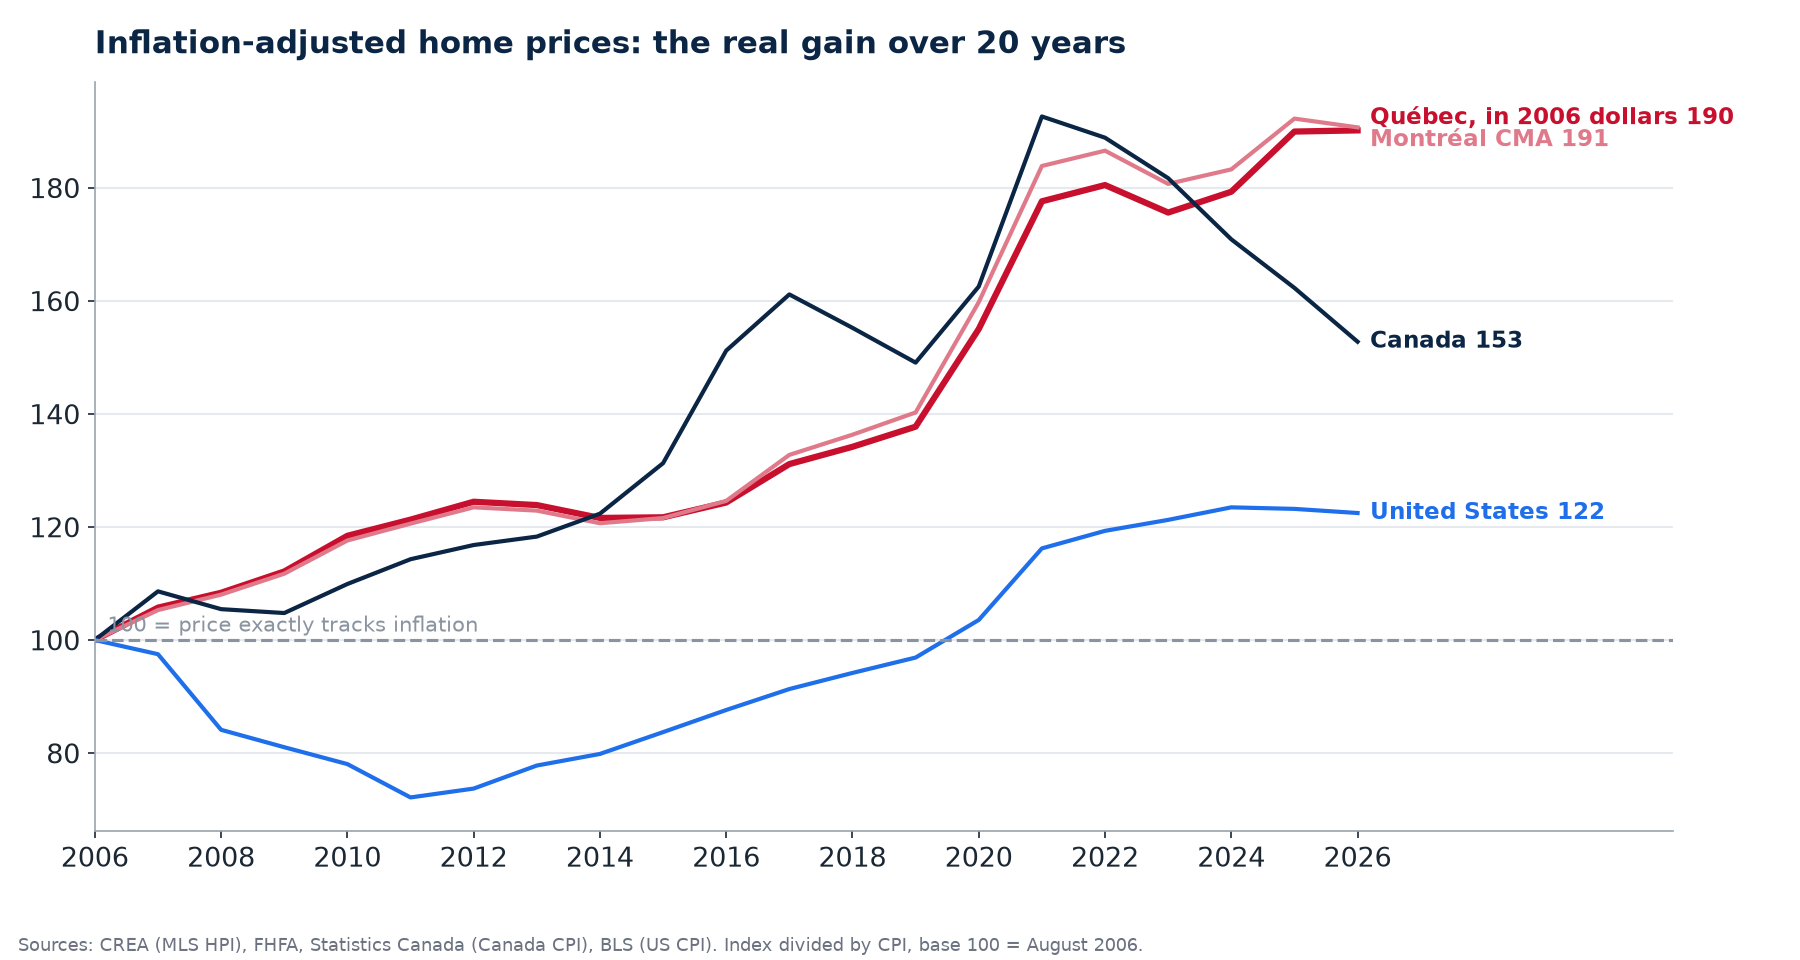
Adjusted for CPI, the Québec home gained 3.3% a year in purchasing power, Canada 2.1%, the United States 1.0%. Québec fell in real terms only three times in 20 years (2013, 2014 and 2023, the year inflation ran faster than prices), against nine times for Canada as a whole. That is the very definition of an inflation hedge: it does not merely keep pace, it pulls ahead, and without the air pockets of financial markets.
5. Leverage: why a 20% down payment changes everything
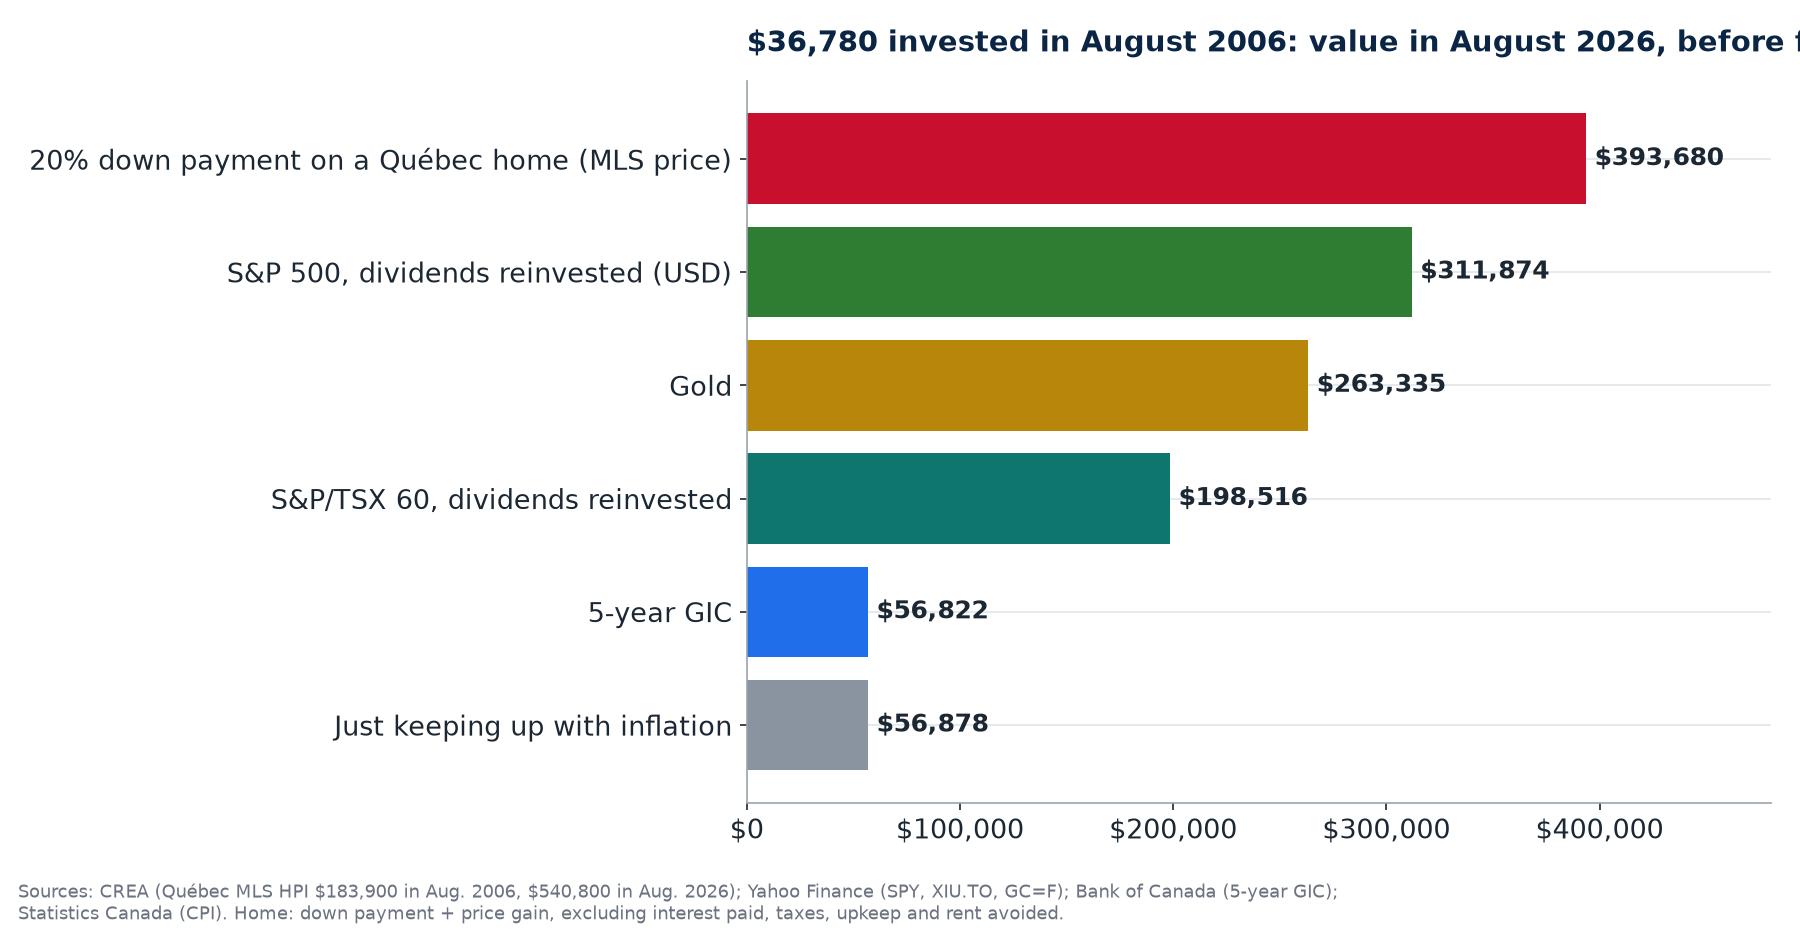
In August 2006, 20% of the Québec benchmark home was $36,780. Twenty years later, the home's price gain ($356,900) plus the down payment add up to $393,680, or 10.7 times the money. The same $36,780 in the S&P 500 gives $311,874, in gold $263,335, in the TSX 60 $198,516, and in a GIC $56,822.
This calculation has limits that must be named. It does not count the interest paid on the $147,120 mortgage: at 5.5% over 25 years, that is $115,486 of interest in 20 years, with $100,036 of principal repaid that adds to net worth. It does not count property taxes, upkeep, the welcome tax or selling costs either. On the other side, it does not count the rent a tenant would have paid for 20 years, nor the fact that the gain on a principal residence is tax-free in Canada, while a stock gain outside a TFSA or RRSP is taxed. The calculation does not say the home beats stocks for everyone. It says that, for a household that has to live somewhere anyway, the roof over its head was both the most stable and, once leverage is counted, the most rewarding investment of the past 20 years. To go further, read our guide on first-time buyer programs in Québec and our page on real estate investing in Québec.
What it means in September 2026
The Québec market enters the fall with prices still rising but at a calmer pace: in August 2026, the APCIQ measured a median single-family price of $497,501 across the province (+2% year over year) and $650,000 in the Montréal CMA (+3%), with active listings up 21% and sales down 7%. Across Canada, CREA reports an average price of $668,219 (+0.6%) and an MLS HPI down 3% year over year. In other words, the 2026 buyer has more choice and fewer bidding wars than in 2021, and the Québec seller is still selling into a market that has not had a down year in 20 years. Our pages on current mortgage rates in Canada, the Bank of Canada rate forecast for 2027 and the Canadian average home price forecast for 2027 complete this one. For a first income property, see buying an owner-occupied plex in Québec.
Frequently asked questions
Did real estate beat inflation in Québec over 20 years?
Yes, by a wide margin: +194% for the benchmark home price (CREA MLS HPI, August 2006 to August 2026) against +55% for the Canadian CPI. In real dollars, the home is worth 1.9 times its 2006 value.
Was real estate the best-performing investment of the past 20 years?
Without leverage, no: the S&P 500 with dividends (×8.5 in US dollars), gold (×7.2) and the S&P/TSX 60 (×5.4) did more than the Québec home (×2.9). With a 20% down payment, the home moves ahead ($393,680 against $311,874 for the S&P 500 on $36,780 invested), before interest, taxes and fees, and without counting rent avoided.
Has a Québec home ever lost value in 20 years?
Not year over year: across 20 annual changes (August to August), the Québec and Montréal indexes never fell. The Canadian index fell 6 times, US homes 5 years in a row (2007 to 2011), the TSX 60 4 times and the S&P 500 3 times.
Does a GIC protect against inflation?
Over 20 years, a 5-year GIC rolled over at the Bank of Canada's posted rates turned $100 into $154, and it took $155 to keep up with inflation. It preserved the capital, not the purchasing power.
Sources, all read on September 16, 2026: Canadian Real Estate Association (CREA), MLS Home Price Index, September 2026 file (August 2006 to August 2026 values for Canada, Québec, the Montréal CMA, the Québec City CMA and Centre-du-Québec); FHFA, purchase-only House Price Index, United States, June 2026; Statistics Canada, all-items CPI, Canada (table 18-10-0004, series v41690973); U.S. Bureau of Labor Statistics, CPI-U (CUUR0000SA0); Bank of Canada, 5-year GIC (V80691341) and 5-year posted mortgage rate (V80691335), annual averages; Yahoo Finance, adjusted close of the XIU.TO and SPY ETFs, gold price (GC=F, August 2010 and August 2021 missing); APCIQ, August 2026 monthly statistics; CREA, September 15, 2026 news release. Stock returns are before fees and taxes; the S&P 500 and gold are in US dollars. This page is informational: a real estate broker is not a financial advisor, and past performance does not guarantee the future.
Our proof, not our promises
The Loaa & Manseur team, led by Lotfi Manseur and Loaa Al Daow, is the number 1 team at RE/MAX Platine in 2024 and 2025, 6th RE/MAX team in Quebec, 15th in Canada and in the global top 50 of large residential teams according to the official RE/MAX ranking, computed on actual transactions. Its Google profile counts more than 220 reviews with a 4.9 rating. Its offices are at 55 avenue de l'Équinoxe in Brossard, one bridge from the island, and every broker's licence can be checked in the OACIQ public register. Three things to verify yourself before calling us, and to demand of any other broker.
Also available in French: version française de ce guide.
Published September 7, 2026 by the Loaa & Manseur team, the number 1 team at RE/MAX Platine in 2024 and 2025, 6th RE/MAX team in Quebec, 15th in Canada and in the global top 50 according to the official RE/MAX ranking. Tell us about your project.