Home prices · Ville-Marie (downtown) · Centris 2016-2026
The median sale price of single-family homes, condos and plexes in Ville-Marie year by year since 2016, then days to sell, sold-to-asking ratio and inventory month by month. Centris figures, not estimates.
In Ville-Marie, the median sale price of a single-family home went from $844,250 in 2016 to $1,063,000 in 2026 (January to August), a +26% change over ten years, or 2.3% a year. Condos went from $339,500 to $460,000 (+35%) and 2-to-5-unit plexes from $565,000 to $1,040,000 (+84%). In Sep. 2026, a single-family home sold in 127 days (median), at 90% of asking price, with 80 active listings and 11 new listings during the month. Over ten years, the annual peak is $1,325,000 in 2021 and the median price fell in 2017, 2022, 2023, 2024, 2026. Source: Centris (Matrix), compiled September 16, 2026. Median price per square foot over 12 months: condo $640, single-family $641 per square foot.
The short answer
In Ville-Marie, the median sale price of a single-family home went from $844,250 in 2016 to $1,063,000 in 2026 (January to August), a +26% change over ten years, or 2.3% a year. Condos went from $339,500 to $460,000 (+35%) and 2-to-5-unit plexes from $565,000 to $1,040,000 (+84%). In Sep. 2026, a single-family home sold in 127 days (median), at 90% of asking price, with 80 active listings and 11 new listings during the month.
Median sale price by year, 2016 to 2026

| Year | Single-family, median price | Sales | Condo, median price | Sales | Plex, median price | Sales |
|---|---|---|---|---|---|---|
| 2016 | $844,250 | 80 | $339,500 | 2,529 | $565,000 | 103 |
| 2017 | $805,000 | 97 | $353,000 | 3,253 | $595,000 | 114 |
| 2018 | $913,750 | 83 | $380,000 | 3,314 | $613,750 | 94 |
| 2019 | $1,079,000 | 92 | $413,500 | 3,562 | $735,000 | 111 |
| 2020 | $1,149,500 | 83 | $445,000 | 2,875 | $892,500 | 108 |
| 2021 | $1,325,000 | 103 | $446,000 | 4,778 | $879,000 | 149 |
| 2022 | $1,215,000 | 54 | $474,500 | 4,213 | $995,000 | 81 |
| 2023 | $1,200,000 | 75 | $468,138 | 4,159 | $832,500 | 60 |
| 2024 | $1,167,500 | 61 | $470,000 | 4,393 | $875,000 | 97 |
| 2025 | $1,240,000 | 65 | $470,000 | 4,645 | $1,034,000 | 117 |
| 2026 (Jan. to Aug.) | $1,063,000 | 54 | $460,000 | 3,334 | $1,040,000 | 60 |
Computed by Matrix from about: single-family, about 850 listings; condo, about 41 000 listings; plex, about 1 100 listings. When a category has few sales in a year, its median swings a lot from one year to the next: read the trend, not a single year.
What ten years of sales say in Ville-Marie
- The annual peak for single-family homes is $1,325,000, reached in 2021.
- From 2019 to 2022, the three pandemic and rock-bottom-rate years, the median price jumped 13% ($1,079,000 to $1,215,000).
- Years when the median price fell from the previous year: 2017, 2022, 2023, 2024, 2026.
- 2026 (January to August) versus 2025: -14.3% ($1,240,000 to $1,063,000).
- Single-family sales recorded on Centris from 2016 to August 2026: 847.
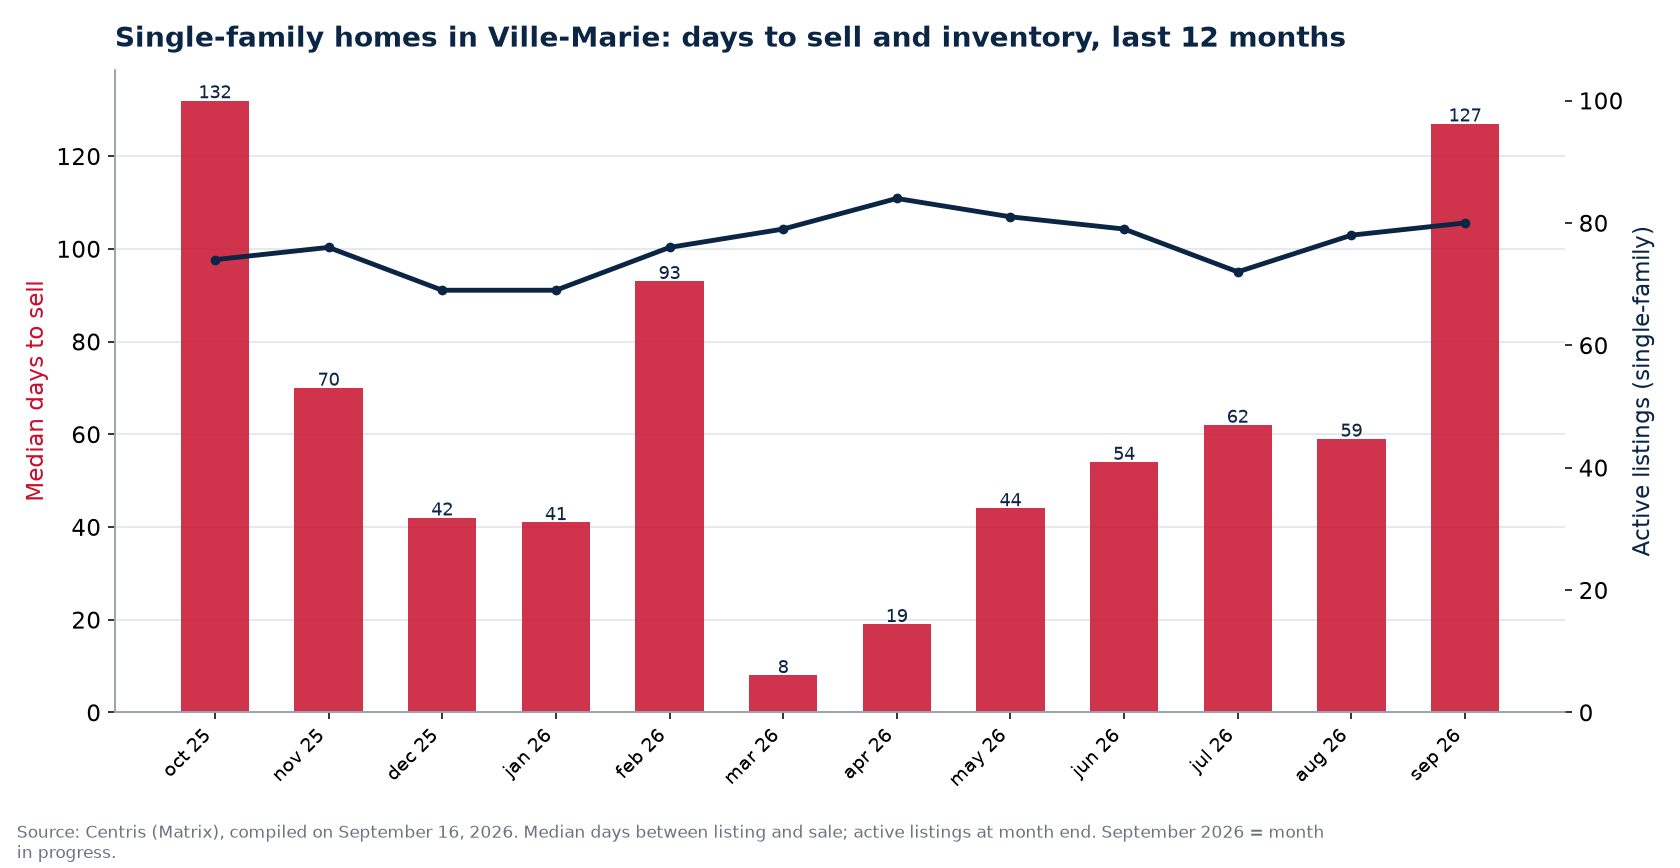
The last 12 months: days to sell, ratio and inventory
| Month | Single-family, median days to sell | Sold / asking | Active listings | New listings | Condo, median days | Condo, sold / asking |
|---|---|---|---|---|---|---|
| Oct. 2025 | 132 | 96% | 74 | 20 | 50 | 97% |
| Nov. 2025 | 70 | 98% | 76 | 9 | 59 | 97% |
| Dec. 2025 | 42 | 100% | 69 | 6 | 57 | 97% |
| Jan. 2026 | 41 | 89% | 69 | 13 | 64 | 97% |
| Feb. 2026 | 93 | 96% | 76 | 20 | 54 | 97% |
| Mar. 2026 | 8 | 96% | 79 | 29 | 40 | 98% |
| Apr. 2026 | 19 | 97% | 84 | 22 | 43 | 97% |
| May 2026 | 44 | 96% | 81 | 20 | 35 | 97% |
| Jun. 2026 | 54 | 94% | 79 | 17 | 43 | 97% |
| Jul. 2026 | 62 | 93% | 72 | 8 | 43 | 97% |
| Aug. 2026 | 59 | 91% | 78 | 16 | 44 | 97% |
| Sep. 2026 | 127 | 90% | 80 | 11 | 50 | 97% |
- Median days to sell: 8 days at the fastest (Mar. 2026), 132 days at the slowest (Oct. 2025); 12-month median: 59 days.
- Sold-to-asking ratio: 1 of 12 months at 100% or more, meaning sales at or above asking price.
- Active listings: 74 in Oct. 2025, 80 in Sep. 2026 (+8%); 191 new single-family listings in 12 months.
Series computed from about: single-family days to sell, ; inventory, about 260 listings; condo days to sell, about 4 300 listings. September 2026 is the month in progress at compilation time.
Price per square foot in Ville-Marie: the last 12 months
Between September 16, 2025 and September 16, 2026, a condo sold for a median $640 per square foot (half of sales between $543 and $756, over 1,395 sales) and a single-family home for $641 per square foot ($487 to $809 for the middle half, 28 sales). The square-foot figure is computed on the living area declared on the listing (Matrix's price-per-square-foot column for condos, sale price divided by living area for single-family homes); sales without a declared area, outliers and rentals are excluded, which explains the gap between sales read and sales kept, especially for houses.
| Category | Median price per sq. ft. | Middle half (Q1 to Q3) | Sales with an area | Sales read | Median sale price |
|---|---|---|---|---|---|
| Single-family | $641 | $487 to $809 | 28 | 50 | $1,110,000 |
| Condo | $640 | $543 to $756 | 1,395 | 1,462 | $460,050 |
Source: Centris (Matrix), sold listings with a status change in the last 12 months, price per square foot computed on the declared living area; aggregates compiled by the team on September 16, 2026. A new condo, a high floor or an included parking spot push the square-foot price up; a garden level or a walk-up pull it down: always compare a property with sales of the same type.
How to read these numbers
The median price is the middle price: half the sales closed above it, half below. It resists exceptional sales better than the average does. The categories are Centris's own: "Single-family", "Condominium" and "Income property" of 2 to 5 units. The year 2026 covers January to August; median days to sell count the days between listing and an accepted offer; the sold-to-asking ratio compares the sale price with the last listed price. These statistics describe Ville-Marie (downtown) as a whole: a neighbourhood, a street or a type of house can differ sharply, which is exactly what a market value evaluation pins down.
Frequently asked questions
What is the median price of a house in Ville-Marie in 2026?
$1,063,000 for a single-family home (Centris sales from January to August 2026), $460,000 for a condo and $1,040,000 for a 2-to-5-unit plex.
How long does a sale take in Ville-Marie?
In Sep. 2026, the median for a single-family home was 127 days; over the last 12 months it ranged from 8 to 132 days.
Have prices ever fallen in Ville-Marie?
Yes, the annual median price of single-family homes fell in 2017, 2022, 2023, 2024, 2026 compared with the previous year, before rising again. Over ten years, the increase is +26%.
Source: Centris (Matrix), Statistics module, queries run on September 16, 2026 for the borough of 'Montréal (Ville-Marie)'; medians, counts and ratios compiled by the Loaa & Manseur team. No individual listing data is reproduced. Current-month figures are provisional. Our page on real estate versus inflation over 20 years puts these increases against inflation and stocks, and the home prices in Montreal by borough hub compares neighbouring sectors. The whole city is on the home prices in Montreal page. The 50 Quebec cities are on home prices by city.
The plex, in figures: Plex prices in Ville-Marie: $285,000 per door, GRM 15.7x
And condos in Ville-Marie, in figures:
A condo is worth 43% of a house in Ville-Marie in 2026; our sector page gives ten years of median prices and days to sell over the last 12 months.
Our proof, not our promises
The Loaa & Manseur team, led by Lotfi Manseur and Loaa Al Daow, is the number 1 team at RE/MAX Platine in 2024 and 2025, 6th RE/MAX team in Quebec, 15th in Canada and in the global top 50 of large residential teams according to the official RE/MAX ranking, computed on actual transactions. Its Google profile counts more than 220 reviews with a 4.9 rating. Its offices are at 55 avenue de l'Équinoxe in Brossard, one bridge from the island, and every broker's licence can be checked in the OACIQ public register. Three things to verify yourself before calling us, and to demand of any other broker.
Also available in French: version française de ce guide.
Published September 7, 2026 by the Loaa & Manseur team, the number 1 team at RE/MAX Platine in 2024 and 2025, 6th RE/MAX team in Quebec, 15th in Canada and in the global top 50 according to the official RE/MAX ranking. Tell us about your project.