Mortgage payment · Terrebonne · 2016-2026
The monthly payment on the median house in Terrebonne every year since 2016, computed with the year's Centris price and the 5-year rate banks actually charged: the 2021 trough, the 2023 shock, the share of price and the share of rate, the renewal, and the income it takes. Public figures, not estimates.
In Terrebonne, the median house ($599,000 in 2026 (Jan. to Sept.)) costs $2,557 a month with 20% down ($119,800), a loan of $479,200 amortized over 25 years at the 5-year fixed rate actually charged in 2026 (4.14%). In 2016, the same median house ($260,000) cost $949 a month at 2.67%; in 2021, $1,509 a month at 2.13%. The payment has therefore jumped +169% in ten years, faster than the price (+130%), because the rate changed direction, a payment in line with the 50 cities tracked (median $2,604). Between 2021 and 2026, the payment rose by $1,048 a month: $550 comes from the price and $498 from the rate, so 48% from the rate. Sources: Centris, Bank of Canada, compiled October 8, 2026.
The short answer
In Terrebonne, the median house ($599,000 in 2026 (Jan. to Sept.)) costs $2,557 a month with 20% down ($119,800), a loan of $479,200 amortized over 25 years at the 5-year fixed rate actually charged in 2026 (4.14%). In 2016, the same median house ($260,000) cost $949 a month at 2.67%; in 2021, $1,509 a month at 2.13%. The payment has therefore jumped +169% in ten years, faster than the price (+130%), because the rate changed direction, a payment in line with the 50 cities tracked (median $2,604). Between 2021 and 2026, the payment rose by $1,048 a month: $550 comes from the price and $498 from the rate, so 48% from the rate.
Price, rate and payment by year
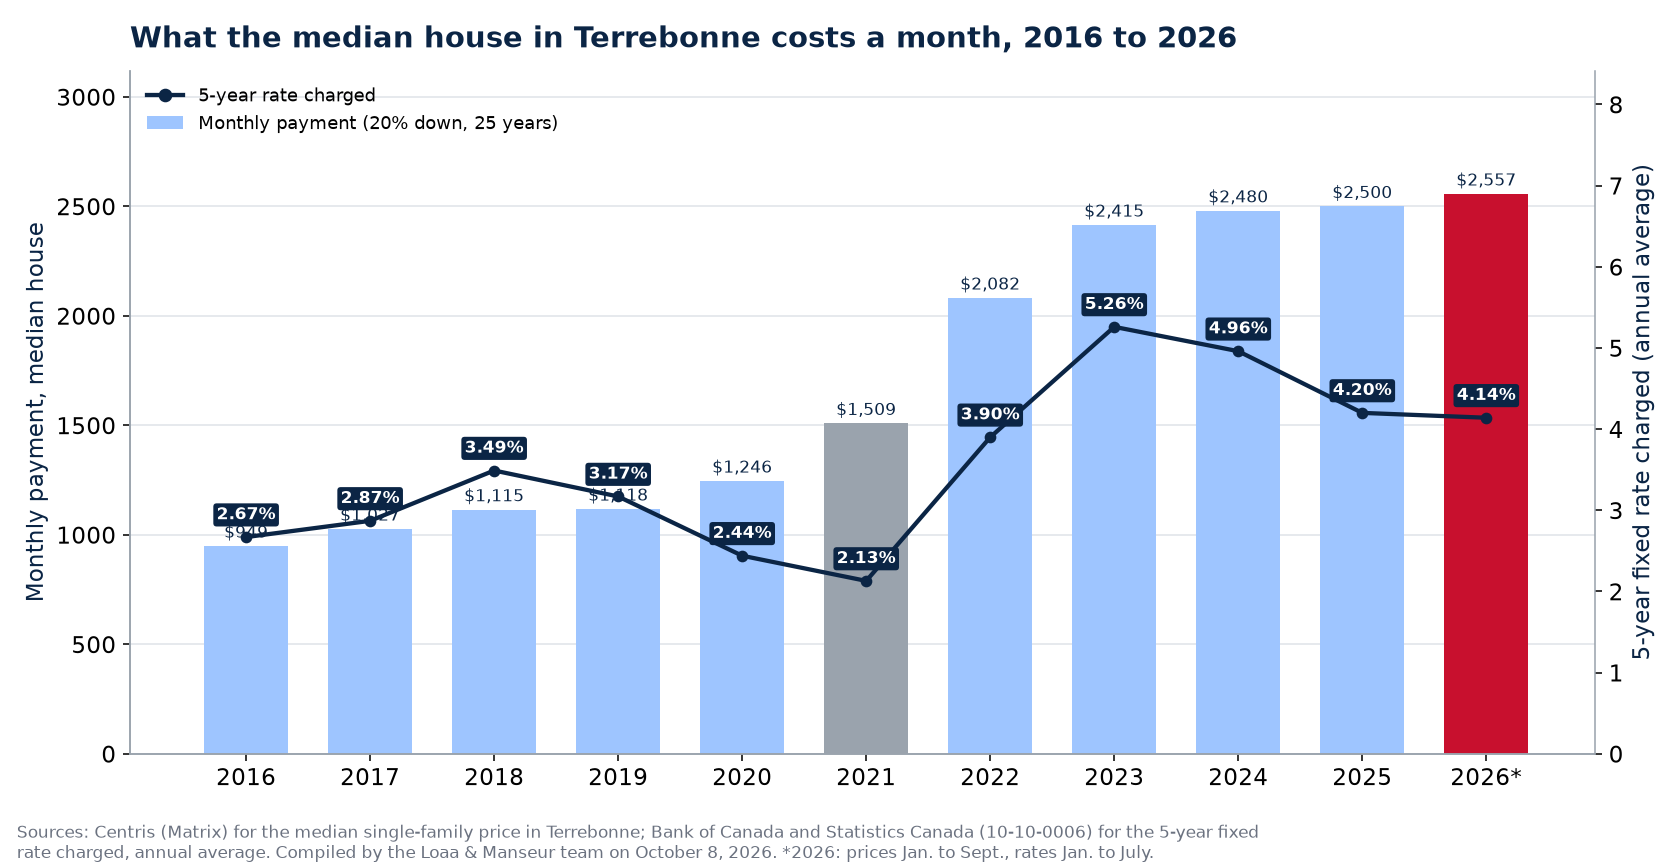
| Year | Median house price | 5-year rate charged | Monthly payment, house | Monthly payment, condo |
|---|---|---|---|---|
| 2016 | $260,000 | 2.67% | $949 | $659 |
| 2017 | $275,000 | 2.87% | $1,027 | $676 |
| 2018 | $279,550 | 3.49% | $1,115 | $718 |
| 2019 | $290,000 | 3.17% | $1,118 | $771 |
| 2020 | $350,000 | 2.44% | $1,246 | $783 |
| 2021 | $439,000 | 2.13% | $1,509 | $1,009 |
| 2022 | $500,000 | 3.90% | $2,082 | $1,476 |
| 2023 | $506,000 | 5.26% | $2,415 | $1,622 |
| 2024 | $535,000 | 4.96% | $2,480 | $1,724 |
| 2025 | $582,000 | 4.20% | $2,500 | $1,581 |
| 2026 (Jan. to Sept.) | $599,000 | 4.14% | $2,557 | $1,631 |
Median price of single-family houses sold in Terrebonne, Centris (Matrix). Rate: annual average of 5-year fixed rates charged on new mortgages (Bank of Canada, Statistics Canada 10-10-0006). Payment: 20% down, 25 years, semi-annual compounding. 2026: rates January to July.
What ten years of payments say in Terrebonne

- The price rose +130% from 2016 to 2026 in Terrebonne; the 5-year rate went from 2.67% to 4.14% by way of 2.13% in 2021: the payment rose +169%. The peak is 2026 ($2,557), the trough 2016 ($949).
- The 2026 house at the 2021 rate would cost $2,059 a month; the 2021 house at the 2026 rate would cost $1,874 a month. Here, price and rate weigh about equally in the increase since 2021.
- The renewal shock: a median house bought in Terrebonne in 2021 ($439,000, 2.13%) cost $1,509 a month; at the 2026 renewal, with a balance of about $295,004 and 20 years left at 4.14%, the payment goes to $1,804 a month, +295 $ a month (+20%).
- Each point of rate up or down is worth $268 a month on the 2026 median house in Terrebonne. At the banks' posted rate (6.09%), the one used for the stress test, the payment would be $3,092 a month.
- The median condo in Terrebonne ($382,000) costs $1,631 a month in 2026, against $659 a month in 2016: $926 a month less than the house, before condo fees.
- Order of magnitude for income: if the mortgage alone must stay under 32% of gross income, it takes $95,888 a year for the median house in Terrebonne in 2026, taxes, heating and other debts not counted. The detail of the calculation and the minimum down payment is in down payment to buy in Terrebonne.
- Across the 50 cities tracked, the median payment went from $953 in 2016 to $1,549 in 2021 and $2,604 in 2026 (+162% in ten years); it doubled in 48 cities, exceeds $2,000 in 37 and $3,000 in 15. The rate explains 48% of the increase since 2021 in median.
What it changes for buying or selling in Terrebonne
At $2,557 a month, the median house in Terrebonne calls for an income in the range of $95,888 a year for the mortgage alone: doable on two incomes, tight on one. The rate matters as much as the price: a point less brings $268 a month back, and that is what buyers watch when they decide to step in or wait. For a seller, the moment rates fall is when buyers come back, not the moment to cut the price. For someone renewing a 2021 mortgage in 2026, the $295 a month gap is to be planned for before deciding to keep or sell: house appreciation by year bought in Terrebonne says what the house gained in the meantime.
How to read these figures
One payment per year for all of Terrebonne: what the house in the middle of the market costs each month, financed the way most buyers finance it, 20% down over 25 years. Each year's rate is the average rate charged by banks on 5-year fixed mortgages (Bank of Canada), not an estimate. The gross income shown is an order of magnitude: it counts only the mortgage at 32% of income, without the taxes, heating and other debts the lender adds to its ratios. The down payment in Terrebonne page runs the calculation with the 2026 rules.
Frequently asked questions
What does the median house in Terrebonne cost a month in 2026?
$2,557 a month for the median house of $599,000, with 20% down ($119,800), 25-year amortization and the 5-year rate charged in 2026 (4.14%). Taxes, heating and insurance on top.
Has the payment ever been higher in Terrebonne?
Yes: $2,557 a month in 2026, the highest of the eleven years, against $949 a month in 2016 and $1,509 a month in 2021. Between 2021 and 2026, the price explains $550 of the monthly increase and the rate $498.
What income does the median house in Terrebonne take?
About $95,888 of gross income a year if the mortgage alone is capped at 32% of income, without taxes or heating. On two incomes, that is $47,944 each. The lender adds taxes, heating and other debts to its ratios, which raises the bar.
Sources: Centris (Matrix), Statistics module, September 16, 2026 query for the municipality of Terrebonne, median sale price of single-family houses and condos by year; Bank of Canada and Statistics Canada, table 10-10-0006, interest rates on funds advanced, residential mortgages, fixed rate 5 years and over, annual average of insured and uninsured loans; compiled by the Loaa & Manseur team, calculation at 20% down and 25 years, aggregates only. The mortgage payment in 50 cities hub compares the 50 cities.
Our other data series in Terrebonne, from the same Centris listings:
- Home prices in Terrebonne, ten years
- Real estate statistics in Terrebonne 2026, 12 indicators and the rank
Each series is recalculated from actual sales, aggregates only.
Our proof, not our promises
The Loaa & Manseur team, led by Lotfi Manseur and Loaa Al Daow, is the number 1 team at RE/MAX Platine in 2024 and 2025, 6th RE/MAX team in Quebec, 15th in Canada and in the global top 50 of large residential teams according to the official RE/MAX ranking, computed on actual transactions. Its Google profile counts more than 220 reviews with a 4.9 rating. Its offices are at 55 avenue de l'Équinoxe in Brossard, one bridge from the island, and every broker's licence can be checked in the OACIQ public register. Three things to verify yourself before calling us, and to demand of any other broker.
Also available in French: version française de ce guide.
Published September 7, 2026 by the Loaa & Manseur team, the number 1 team at RE/MAX Platine in 2024 and 2025, 6th RE/MAX team in Quebec, 15th in Canada and in the global top 50 according to the official RE/MAX ranking. Tell us about your project.