Market · 45 boroughs and sectors · Q1 to Q3 2026 vs 2025
The same study as for cities, one level down: 45 boroughs and sectors, same definitions, same source, quarter by quarter, 2026 vs 2025.
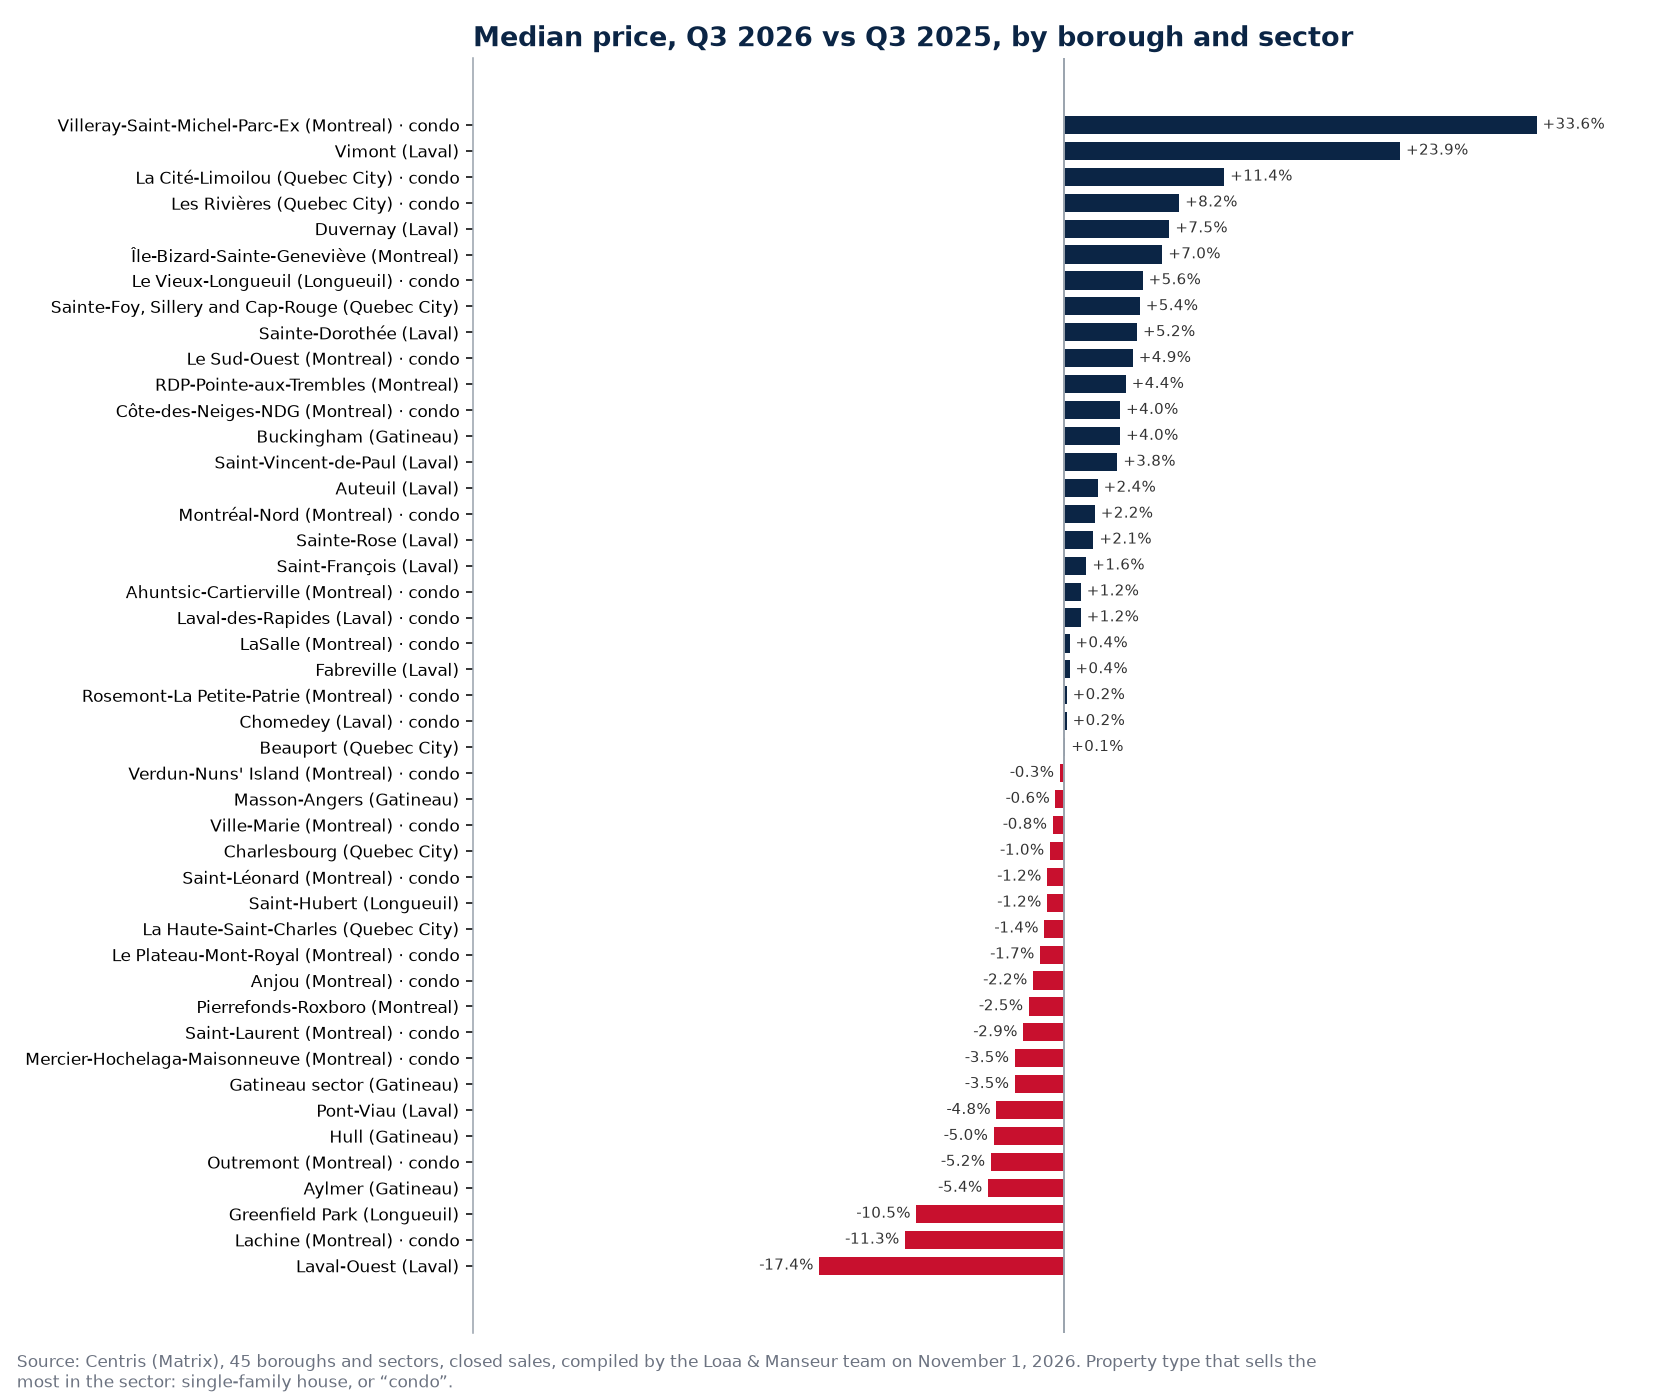
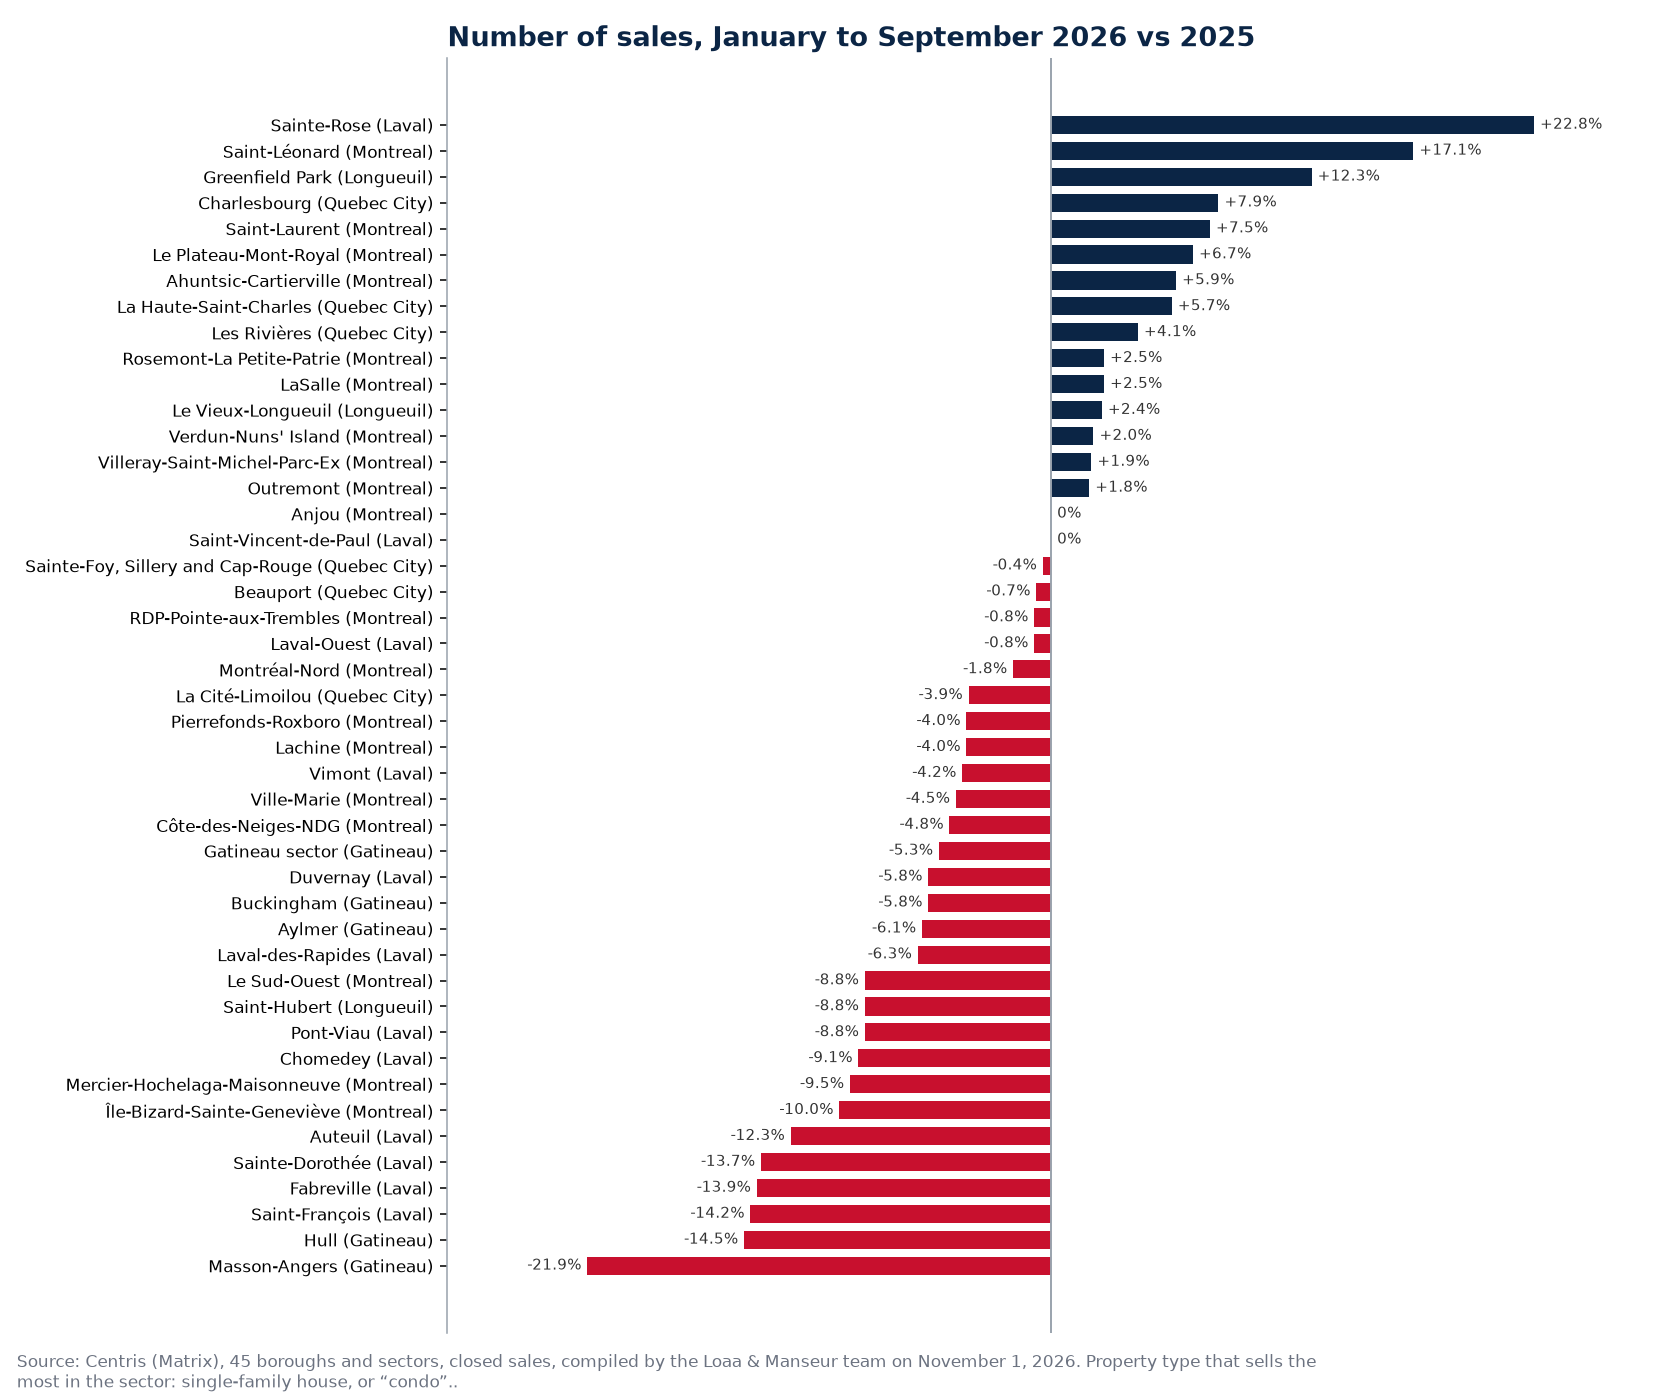
In Q3 2026, the median price of the main property type is higher than a year earlier in 25 of 45 boroughs and sectors and lower in 20; January-to-September sales are down in 28. Source: Centris (Matrix), compiled on November 1, 2026.
The short answer
In Q3 2026 (July to September), the median price is higher than in Q3 2025 in 25 of 45 boroughs and sectors, and lower in 20 (single-family house, or condo where more condos than houses sell: 21 cases). The median change is +0.8% for houses and +0.3% for condos. From January to September, sales are down in 28 boroughs and sectors (median change -3.9%). For whole cities, see our city-by-city study.
Borough by borough
Montreal: 19 boroughs
Whole city: the Montreal market by quarter.
| Borough | Median house Q3 2026 | House, year over year | Median condo Q3 2026 | Condo, year over year | Sales Jan. to Sept. |
|---|---|---|---|---|---|
| Villeray, Saint-Michel and Parc-Extension | $690,000 | +1.2% | $586,500 | +33.6% | +1.9% |
| L'Île-Bizard and Sainte-Geneviève | $750,000 | +7.0% | $353,000 | +13.6% | -10.0% |
| Le Sud-Ouest | $1,072,000 | +17.8% | $515,000 | +4.9% | -8.8% |
| Rivière-des-Prairies and Pointe-aux-Trembles | $605,000 | +4.4% | $347,500 | -2.1% | -0.8% |
| Côte-des-Neiges and Notre-Dame-de-Grâce | $1,289,500 | +11.0% | $550,000 | +4.0% | -4.8% |
| Montréal-Nord | $530,000 | -4.0% | $373,000 | +2.2% | -1.8% |
| Ahuntsic-Cartierville | $917,500 | +0.8% | $420,000 | +1.2% | +5.9% |
| LaSalle | $837,500 | +24.1% | $449,500 | +0.4% | +2.5% |
| Rosemont and La Petite-Patrie | $1,170,000 | +3.5% | $563,200 | +0.2% | +2.5% |
| Verdun and Nuns' Island | $1,172,500 | -19.1% | $617,000 | -0.3% | +2.0% |
| Ville-Marie (downtown) | $1,842,500 | +57.2% | $442,500 | -0.8% | -4.5% |
| Saint-Léonard | $630,000 | -12.6% | $420,000 | -1.2% | +17.1% |
| Le Plateau-Mont-Royal | $1,285,000 | -14.3% | $575,000 | -1.7% | +6.7% |
| Anjou | $587,000 | +3.4% | $385,000 | -2.2% | 0% |
| Pierrefonds-Roxboro | $635,000 | -2.5% | $385,000 | 0% | -4.0% |
| Saint-Laurent | $880,000 | +3.5% | $463,500 | -2.9% | +7.5% |
| Mercier and Hochelaga-Maisonneuve | $626,000 | +0.2% | $415,000 | -3.5% | -9.5% |
| Outremont | $2,725,000 | +16.7% | $770,000 | -5.2% | +1.8% |
| Lachine | $645,000 | -3.4% | $377,500 | -11.3% | -4.0% |
Laval: 12 sectors
Whole city: the Laval market by quarter.
| Sector | Median house Q3 2026 | House, year over year | Median condo Q3 2026 | Condo, year over year | Sales Jan. to Sept. |
|---|---|---|---|---|---|
| Vimont | $700,000 | +23.9% | $355,000 | -2.7% | -4.2% |
| Duvernay | $735,000 | +7.5% | $530,000 | +14.0% | -5.8% |
| Sainte-Dorothée | $728,400 | +5.2% | $682,500 | -5.4% | -13.7% |
| Saint-Vincent-de-Paul | $602,250 | +3.8% | $439,000 | n/a | 0% |
| Auteuil | $640,000 | +2.4% | $395,000 | -10.5% | -12.3% |
| Sainte-Rose | $670,000 | +2.1% | $456,000 | +6.0% | +22.8% |
| Saint-François | $542,500 | +1.6% | n/a | n/a | -14.2% |
| Laval-des-Rapides | $650,000 | +8.3% | $370,000 | +1.2% | -6.3% |
| Fabreville | $560,000 | +0.4% | $416,000 | +2.5% | -13.9% |
| Chomedey | $641,250 | +3.5% | $450,000 | +0.2% | -9.1% |
| Pont-Viau | $545,000 | -4.8% | $518,500 | +11.5% | -8.8% |
| Laval-Ouest | $415,000 | -17.4% | n/a | n/a | -0.8% |
Longueuil: 3 boroughs
Whole city: the Longueuil market by quarter.
| Borough | Median house Q3 2026 | House, year over year | Median condo Q3 2026 | Condo, year over year | Sales Jan. to Sept. |
|---|---|---|---|---|---|
| Le Vieux-Longueuil | $625,000 | 0% | $398,500 | +5.6% | +2.4% |
| Saint-Hubert | $577,500 | -1.2% | $395,000 | +3.9% | -8.8% |
| Greenfield Park | $554,000 | -10.5% | $365,000 | 0% | +12.3% |
Gatineau: 5 sectors
Whole city: the Gatineau market by quarter.
| Sector | Median house Q3 2026 | House, year over year | Median condo Q3 2026 | Condo, year over year | Sales Jan. to Sept. |
|---|---|---|---|---|---|
| Buckingham | $390,000 | +4.0% | n/a | n/a | -5.8% |
| Masson-Angers | $407,500 | -0.6% | n/a | n/a | -21.9% |
| Gatineau sector | $455,250 | -3.5% | $300,000 | -8.4% | -5.3% |
| Hull | $475,000 | -5.0% | $289,900 | -3.0% | -14.5% |
| Aylmer | $530,000 | -5.4% | $305,000 | -8.7% | -6.1% |
Quebec City: 6 boroughs
Whole city: the Quebec City market by quarter.
| Borough | Median house Q3 2026 | House, year over year | Median condo Q3 2026 | Condo, year over year | Sales Jan. to Sept. |
|---|---|---|---|---|---|
| La Cité-Limoilou | $532,000 | -3.3% | $380,000 | +11.4% | -3.9% |
| Les Rivières | $474,000 | -1.2% | $348,944 | +8.2% | +4.1% |
| Sainte-Foy, Sillery and Cap-Rouge | $603,000 | +5.4% | $358,000 | +9.5% | -0.4% |
| Beauport | $430,000 | +0.1% | $320,000 | +4.9% | -0.7% |
| Charlesbourg | $445,500 | -1.0% | $284,500 | +7.8% | +7.9% |
| La Haute-Saint-Charles | $435,000 | -1.4% | $325,000 | +4.4% | +5.7% |
Year over year: Q3 2026 vs Q3 2025. Sales: houses and condos, January to September 2026 vs the same period of 2025. n/a: fewer than 10 sales in the quarter.
What the tables say
Largest Q3 rise in the median house price: Vimont (+23.9%), Duvernay (+7.5%), L'Île-Bizard and Sainte-Geneviève (+7.0%). Smallest: Aylmer (-5.4%), Greenfield Park (-10.5%), Laval-Ouest (-17.4%). At the neighbourhood level, fewer properties sell than in a whole city, so a quarterly median moves more with the mix of properties sold. Look at all three quarters on your area's page before drawing conclusions.
Method
Centris (Matrix) Statistics module, queried on November 1, 2026 with the same settings for each borough or sector (Centris "City (sector)" municipality option): closed sales, median sale price, number of sales, median days on market and sale-to-asking price, for each quarter of 2025 and 2026. House: Single-family; condo: Divided co-ownership. Fewer than 10 sales: median left blank. Aggregates only.
Frequently asked questions
Is the market going down in my neighbourhood?
Find your borough or sector in the tables above: each page gives the median price, sales, days on market and sold-to-asking, quarter by quarter.
My area is not listed?
We publish the areas where sales are numerous enough for reliable quarterly medians. A broker on our team can pull the same statistics for any area.
Also available in French: version française de ce guide.
Published September 7, 2026 by the Loaa & Manseur team, the number 1 team at RE/MAX Platine in 2024 and 2025, 6th RE/MAX team in Quebec, 15th in Canada and in the global top 50 according to the official RE/MAX ranking. Tell us about your project.